The Mac version of the graphing app Graph Sketcher now has templates (version 2.2.0). Choose a graph from “Templates” in the toolbar and one click puts it in your document. There are 19 graphs to choose from, including supply and demand, cost curves, the Lorenz curve and the normal distribution.
A graph from a template is made of ordinary lines, points, text and fills. You can change the colors, widths and label wording, export it as a vector PDF or PNG, and use it in class materials, papers and exam questions.
Graph Sketcher is a Mac and Windows app that turns hand-drawn lines into smooth curves. Economics and math diagrams use the same shapes again and again. With templates, you can start the graphs you use most without drawing them first.
What graphs do the Graph Sketcher templates include?
Graph Sketcher has 19 templates in all: 12 for economics and 7 for math. Click “Templates” in the toolbar to see this list.
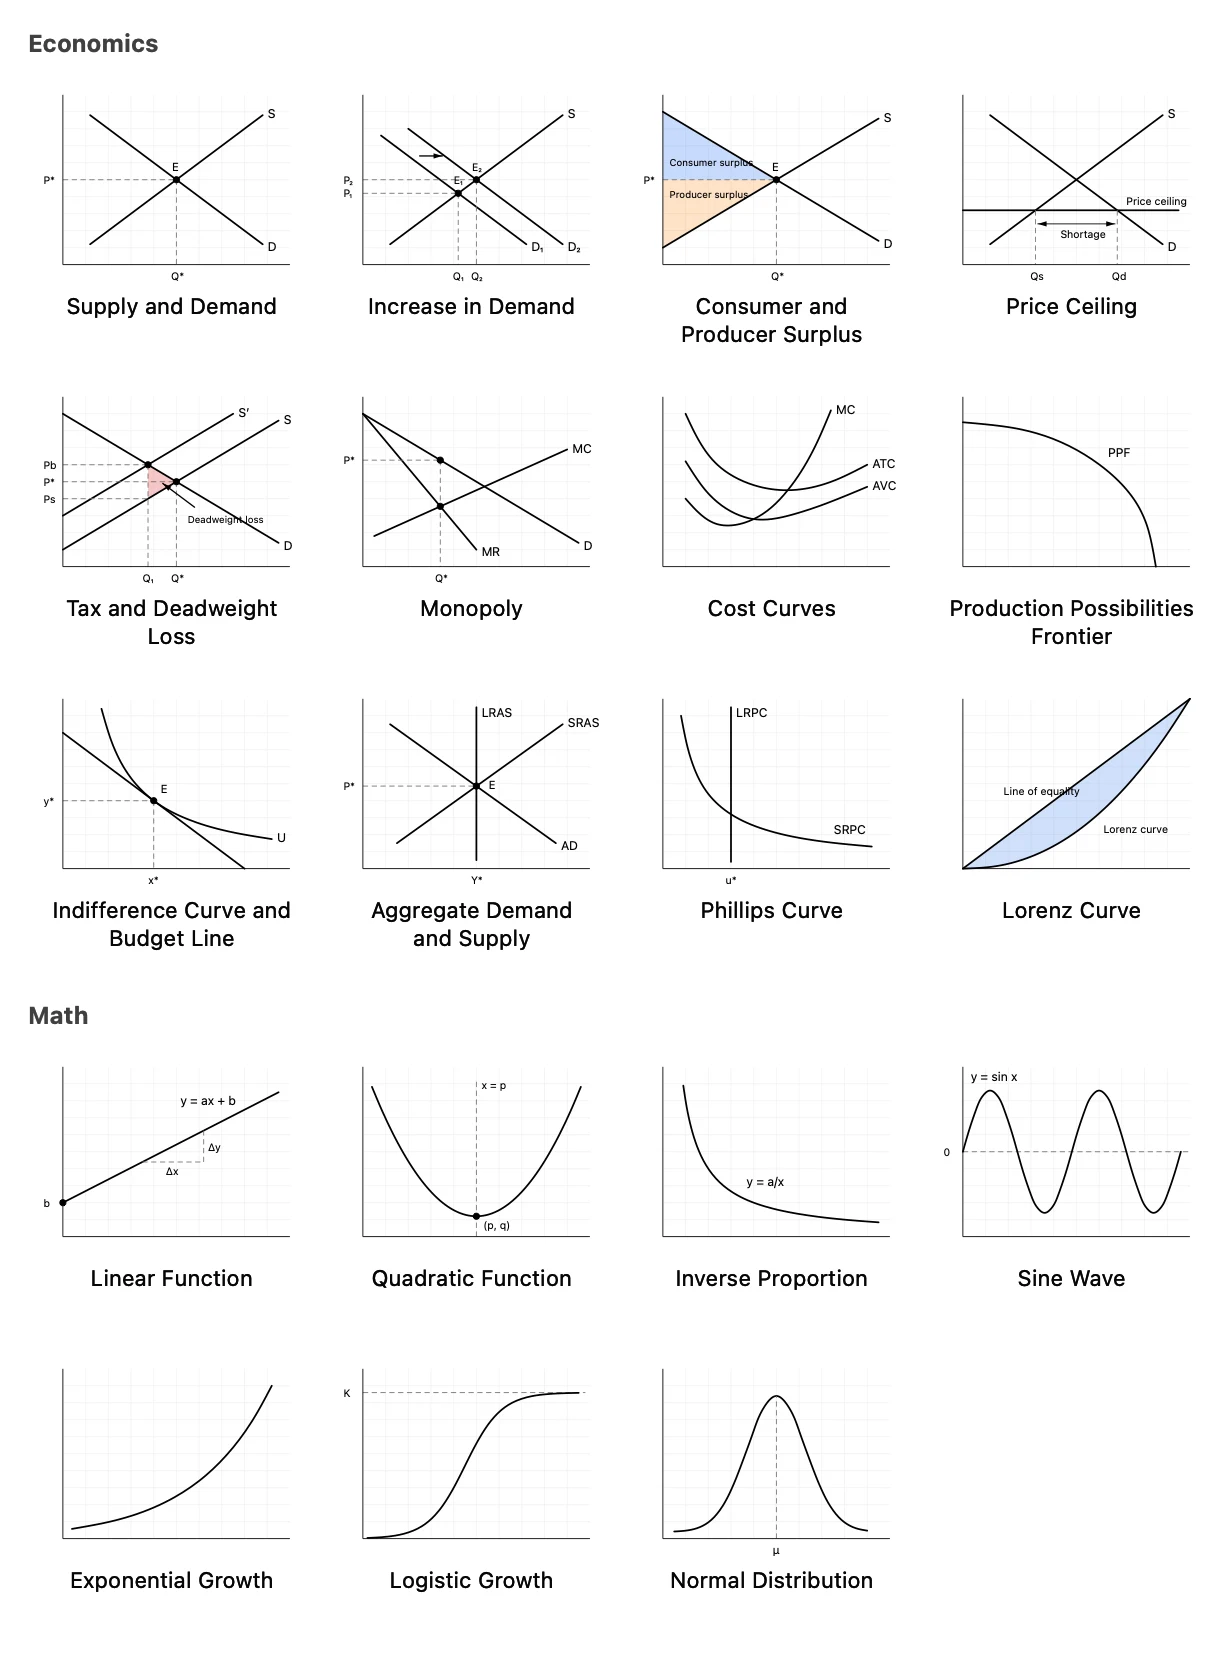
Economics templates (12)
| Template | What it shows |
|---|---|
| Supply and Demand | Equilibrium price and quantity |
| Increase in Demand | A shift in the demand curve and the new equilibrium |
| Consumer and Producer Surplus | The areas of consumer and producer surplus |
| Price Ceiling | A price ceiling and the shortage it causes |
| Tax and Deadweight Loss | The effect of a tax and the deadweight loss |
| Monopoly | A monopolist’s price and quantity (MR and MC) |
| Cost Curves | Marginal cost, average total cost and average variable cost |
| Production Possibilities Frontier | Production combinations of two goods and opportunity cost |
| Indifference Curve and Budget Line | The consumer’s optimal choice |
| Aggregate Demand and Supply | Short-run and long-run aggregate supply (AD, SRAS, LRAS) |
| Phillips Curve | The relationship between unemployment and inflation (SRPC, LRPC) |
| Lorenz Curve | Income inequality and the line of equality |
Math templates (7)
| Template | What it shows |
|---|---|
| Linear Function | y = ax + b and its slope |
| Quadratic Function | y = a(x − p)² + q and its vertex |
| Inverse Proportion | The curve y = a/x |
| Sine Wave | The wave y = sin x |
| Exponential Growth | A curve that rises faster and faster |
| Logistic Growth | An S-shaped curve approaching an upper limit |
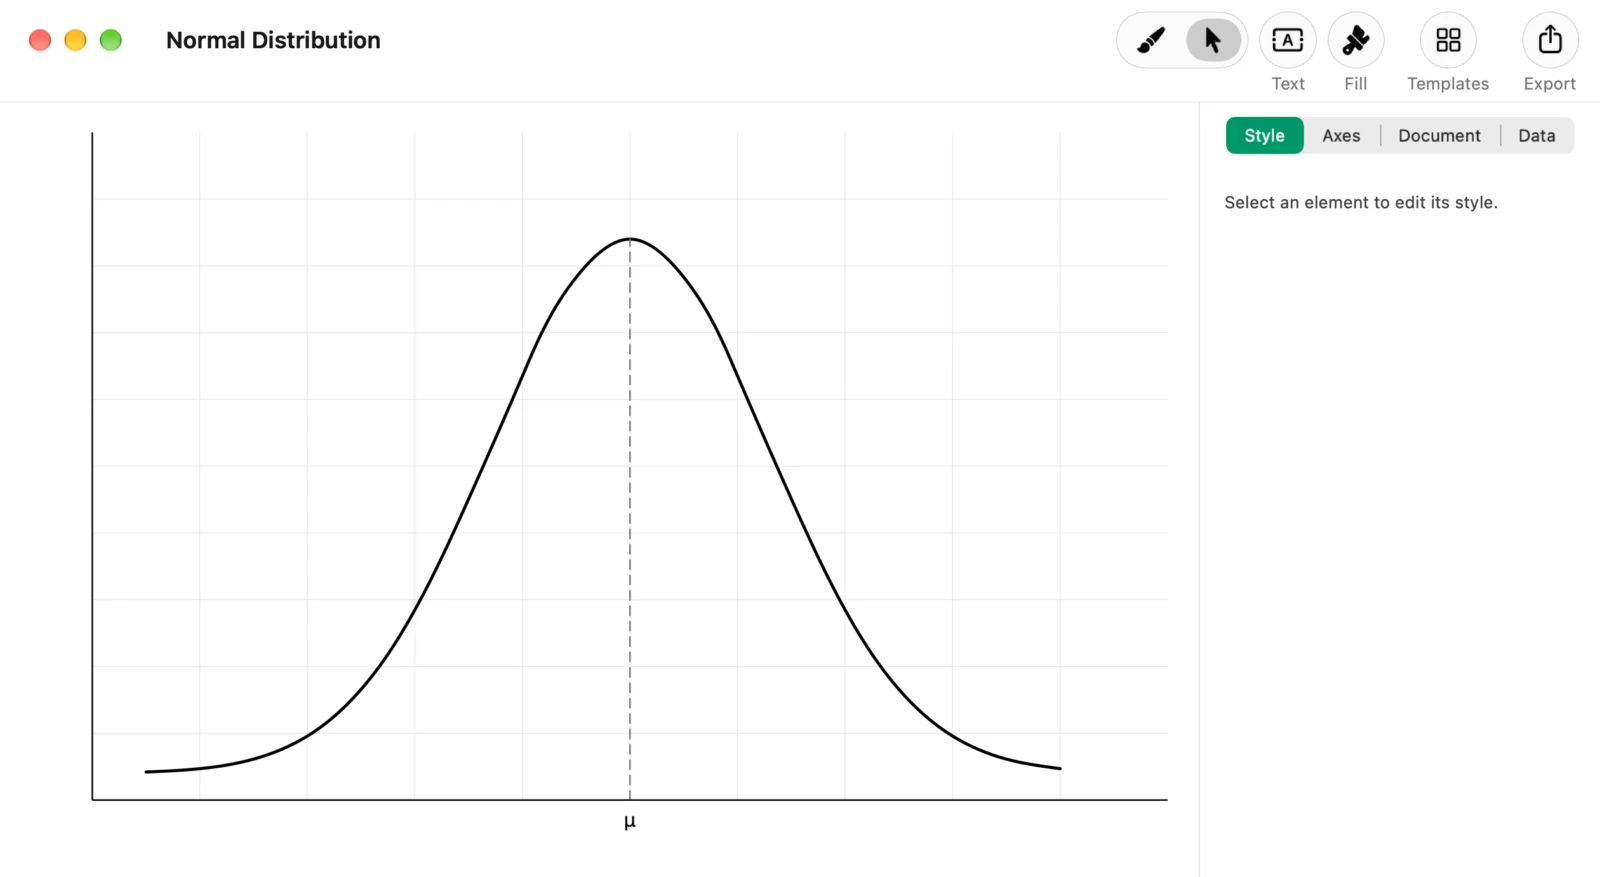
| Normal Distribution | A bell-shaped distribution centered on the mean μ |
How do you use the Graph Sketcher templates?
- Open a new document in Graph Sketcher
- Click “Templates” in the toolbar
- Click the graph you want in the list
- The graph goes into the document and the app switches to the “Modify” tool, so you can edit the lines and text right away
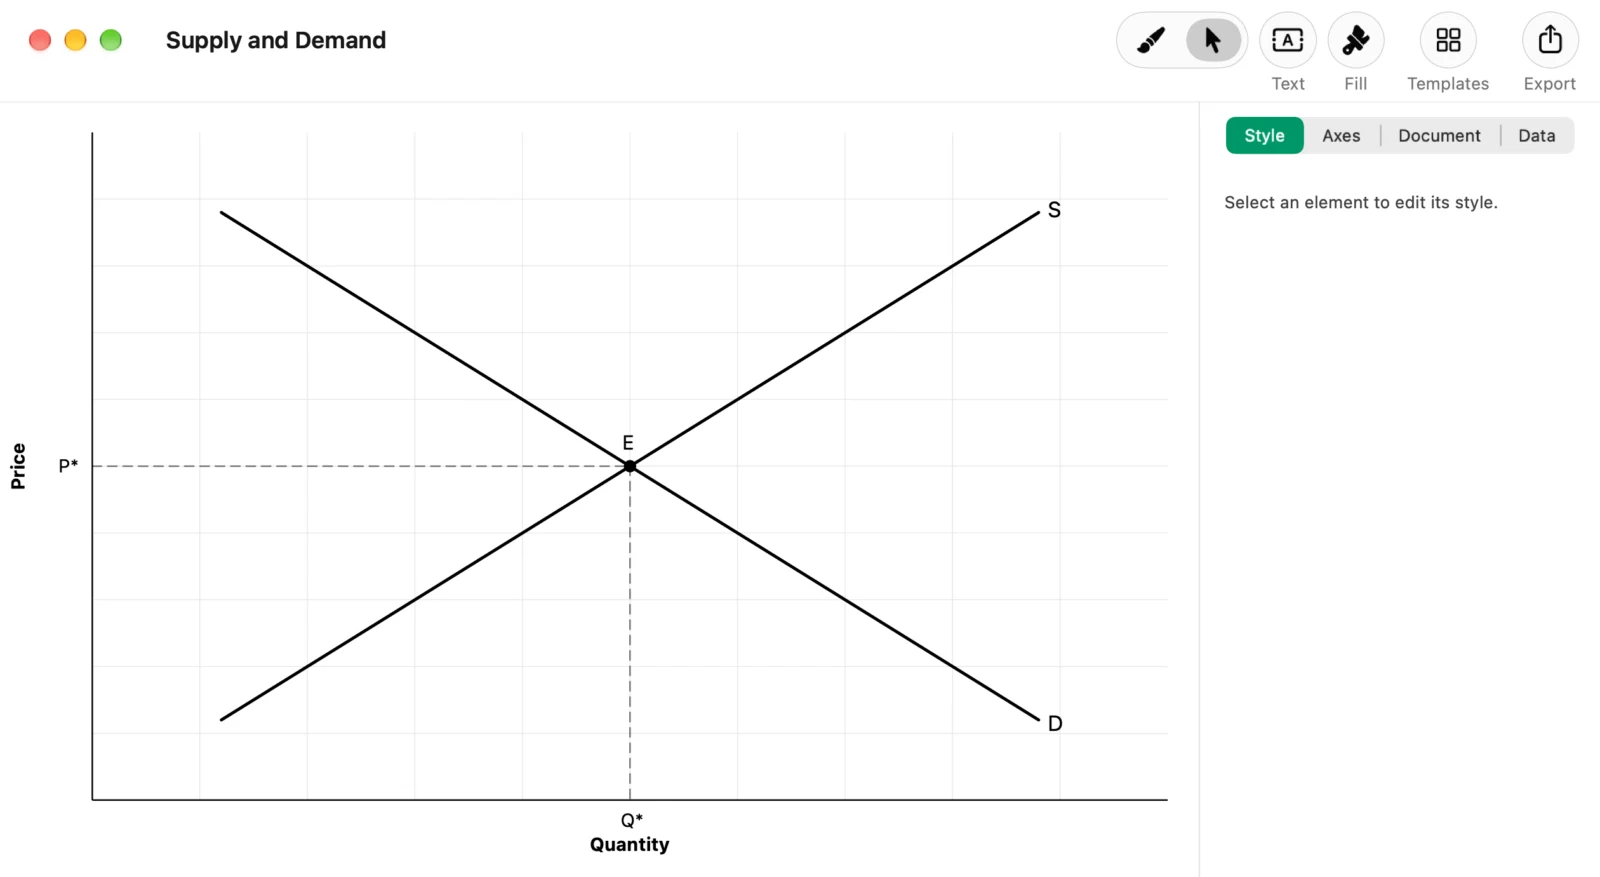
If you insert a template into an empty document, the axis titles are added and the ticks and numbers are hidden, the usual look for a concept diagram. After inserting a template, a single undo takes it back out.
What can you change in a Graph Sketcher template?
You can edit the lines and text from a Graph Sketcher template just as you would ones you drew yourself.
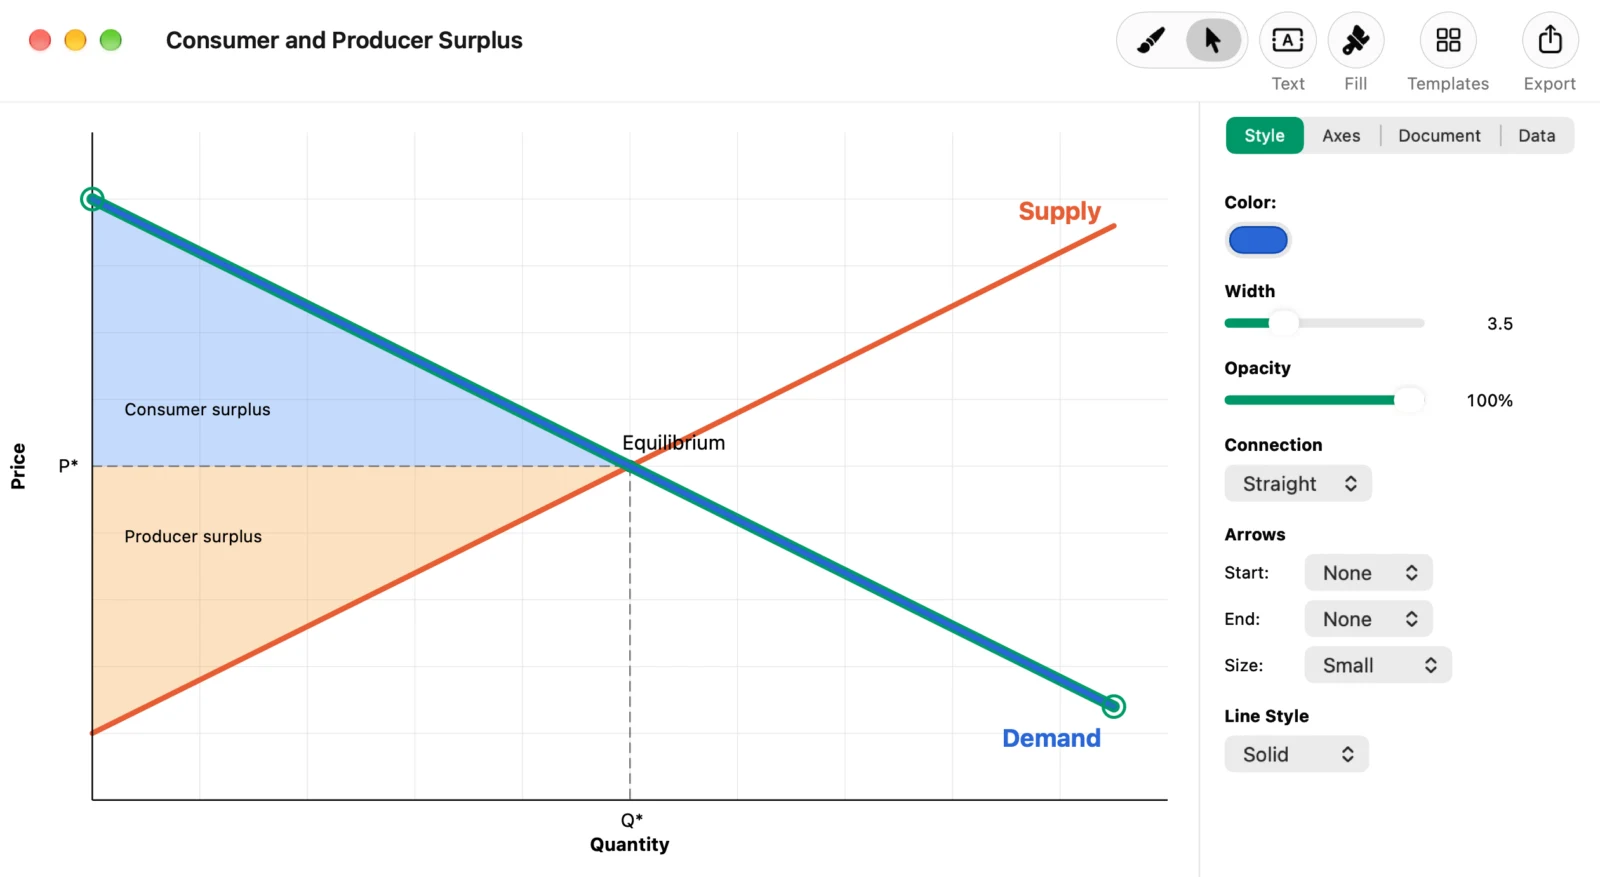
- Lines: change the color, the width, solid or dashed style, and arrows
- Points: drag them to move them, and the line changes shape with them
- Text: change the wording, for example “D” to “Demand”, as well as the font, size and color
- Fills: change the color and opacity
- Axes: change the range, ticks and titles
- Additions: add your own hand-drawn lines, points and text
Do the Graph Sketcher templates work for math and statistics graphs too?
Yes. Graph Sketcher has templates for the linear function, quadratic function, inverse proportion, sine wave, exponential growth, logistic growth and normal distribution, so you can quickly prepare figures for math materials and statistics reports.
How do Graph Sketcher templates differ from drawing in Excel or PowerPoint?
A concept diagram such as a demand curve has no underlying data. To make one in Excel, you have to prepare numbers that fit the shape. In PowerPoint, you arrange lines and shapes by hand and line up the axes and guide lines.
A Graph Sketcher template starts with the axes, curves, guide lines and labels already in place, so you don’t spend time building the shape. Export a vector PDF and the lines stay smooth even when you enlarge the graph in your materials.
How do you use a graph made from a template in your materials?
“Export” in the toolbar saves your graph as PDF, PNG, JPEG or TIFF. A PDF is entirely vector, so it looks sharp at any size. Images are exported at 2× resolution.
How to draw graphs for each field is covered in “Economics graphs, fast and clean: draw them in Graph Sketcher and drop the PDF into PowerPoint”, “Science graphs, fast and clean: draw physics, chemistry and biology diagrams in Graph Sketcher” and “Business graphs, fast and clean: draw break-even charts and product life cycles in Graph Sketcher”.
Graph Sketcher pricing and requirements
The Mac version of Graph Sketcher is free for 3 days from first launch, with every feature including templates. After that, it’s a one-time purchase, not a subscription. It requires macOS 14 or later, and its interface is available in 37 languages, including English. The Windows version came out in November 2026 (Windows version announcement).
Frequently asked questions
How many templates does Graph Sketcher have?
Graph Sketcher has 19 templates: 12 for economics, such as Supply and Demand and Cost Curves, and 7 for math, such as Linear Function and Normal Distribution.
Can I use the templates for free?
Graph Sketcher is free for 3 days from first launch, and that includes the templates. To keep using the app after that, you need to make a one-time purchase. There is no extra charge for the templates.
Can I add a template to a graph I’ve already drawn?
Yes. The template fits the current axis range, and your axis titles and tick settings don’t change.
What language do the words in a template come in?
They come in Graph Sketcher’s display language. That covers the template names and words such as “Quantity”, “Price” and “Consumer surplus”. Symbols such as “D”, “S” and “MC” stay as they are, and you can change them if you need to.
Can I save my own graph as a template?
Not in the current version (2.2.0). For shapes you use often, you can duplicate a document and work from the copy.
Can I use Graph Sketcher on Windows or iPad?
On Windows, yes. The Windows version is on the Microsoft Store. There is no iPad version.
Summary: Graph Sketcher templates
- The templates in Graph Sketcher 2.2.0 let you insert 12 economics graphs and 7 math graphs in one click
- You can change the colors, widths, text and shapes of the inserted graphs directly
- You can export them as vector PDF or PNG and use them in class materials, papers and exam questions