Graph Sketcher is an app that turns a line you trace with a mouse or pen into a clean graph. Following the Mac version, the Windows version is now available on the Microsoft Store. You don’t need a data table or equations. For slides, handouts and papers, Graph Sketcher quickly makes graphs that explain a shape, such as supply and demand, cost curves, parabolas and the normal distribution.
Graph Sketcher for Windows runs on x64 PCs with Windows 11 or Windows 10 (version 1809 or later). Every feature is free to try for the first 7 days. After that, it’s a one-time purchase, not a subscription.
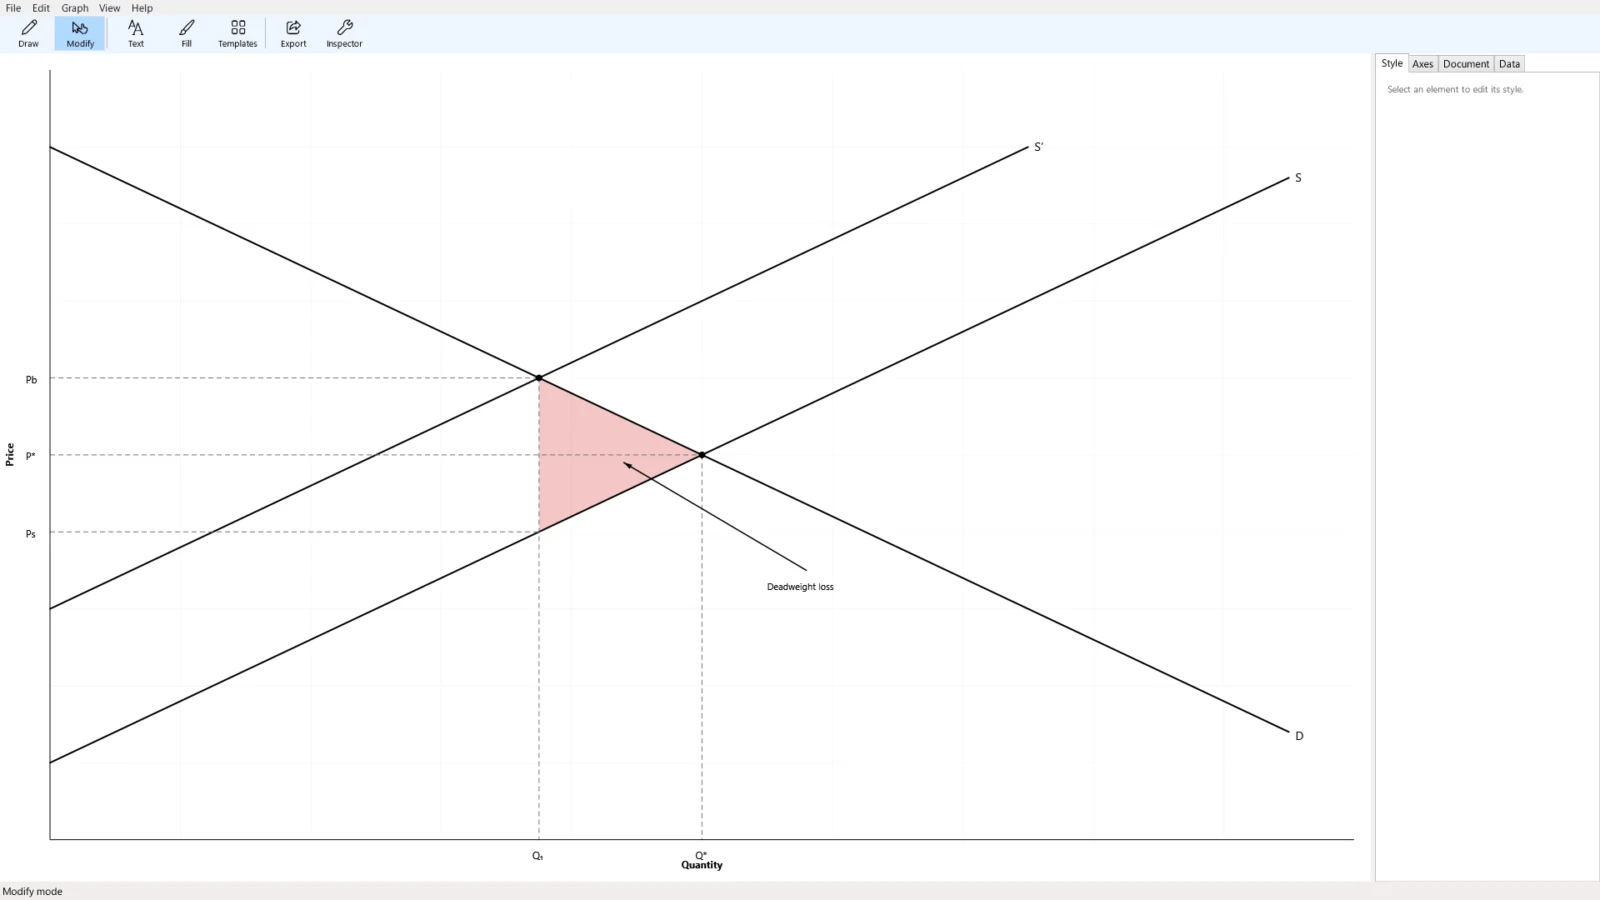
What is Graph Sketcher for Windows?
| Item | Details |
|---|---|
| What it does | Makes graphs from lines you draw by hand. You can also start from a template |
| Supported OS | Windows 11, Windows 10 (version 1809 or later). x64 |
| Interface languages | Japanese and English only |
| Price | 7 days free, then a one-time purchase. The price is shown on the Microsoft Store |
| Templates | 19 in all: 12 for economics and 7 for math |
| Export | PDF (vector), PNG, JPEG, TIFF (at 2× resolution) |
| Document format | .graphsketcher (shared with the Mac version) |
Basic features of Graph Sketcher
Trace a line and it comes out smooth
Drag on the canvas to draw a line, and your stroke automatically becomes a smooth curve or a line of straight segments. You don’t need a data table or equations.
- Click to place points one at a time and connect them into a line. Click the first point again to close the shape
- After drawing, you can drag things to move them and double-click to add points
- Every action can be undone
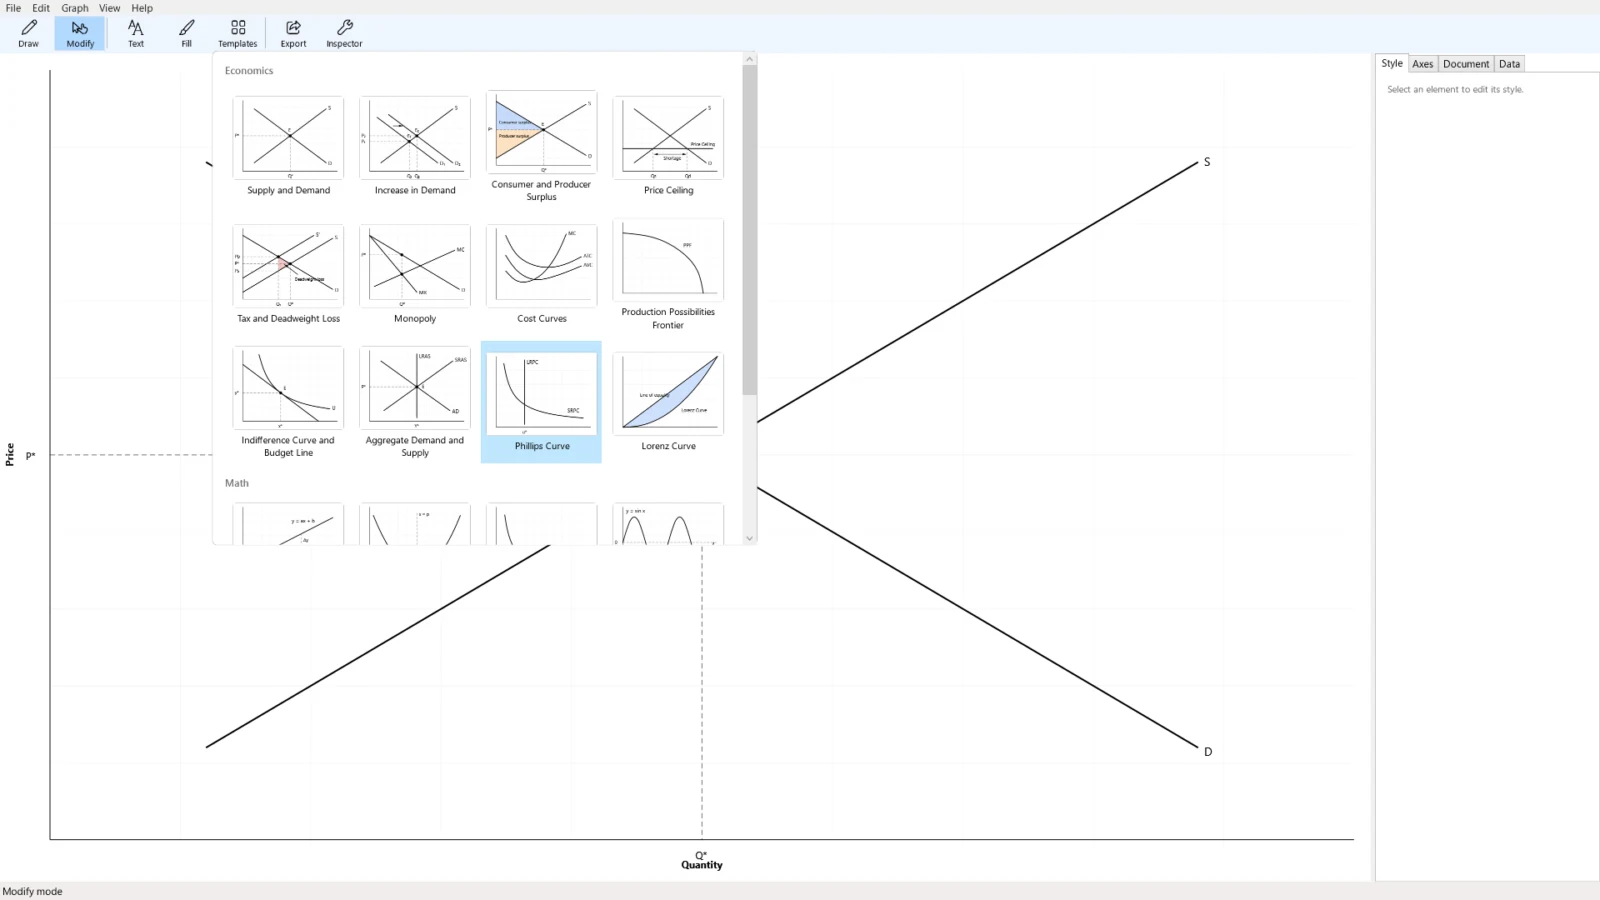
Start from 19 templates
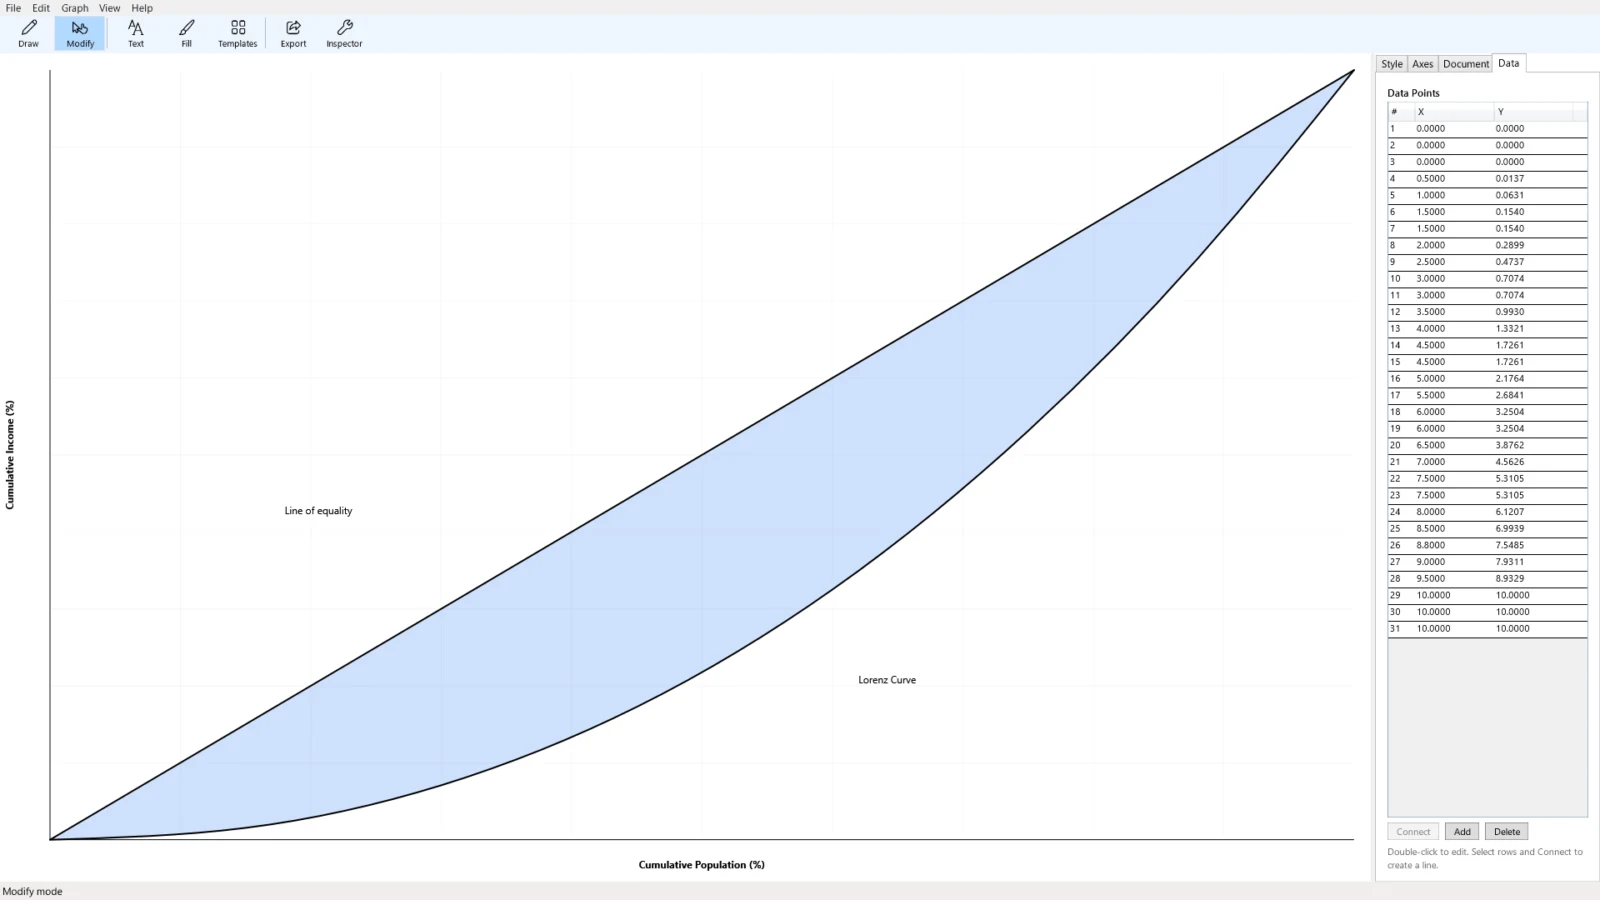
Choose from “Templates” in the toolbar and a commonly used graph goes into your document. There are 12 for economics, including supply and demand, consumer and producer surplus, tax and deadweight loss, cost curves and the Lorenz curve, and 7 for math, including the linear function, quadratic function, sine wave and normal distribution. A template fits the axis range of your document, and you can freely edit it afterward (the template list and how to use it).
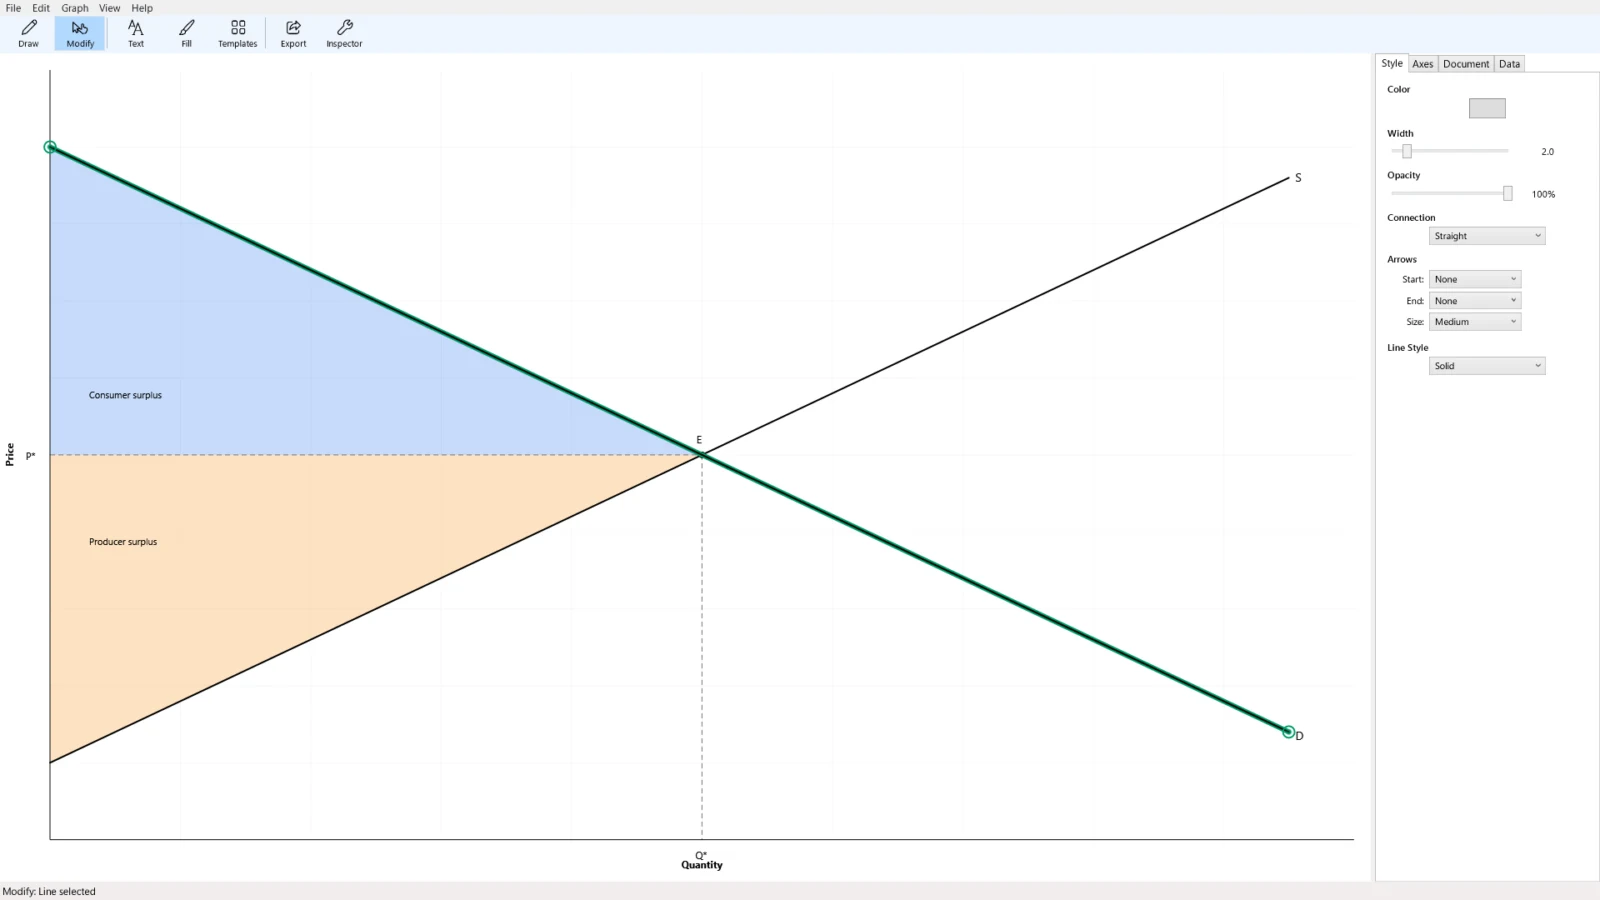
Style lines, points, fills and text
- Lines: color, width, opacity, straight or curved connections, dashed and double lines, and arrows at both ends
- Points: circle, triangle, square, star, diamond and cross
- Fills: choose the color and opacity. Use them for surplus, deadweight loss, the area under a curve and more
- Text: font, size, bold, italic, underline, strikethrough, highlight and rotation. You can edit text directly on the canvas
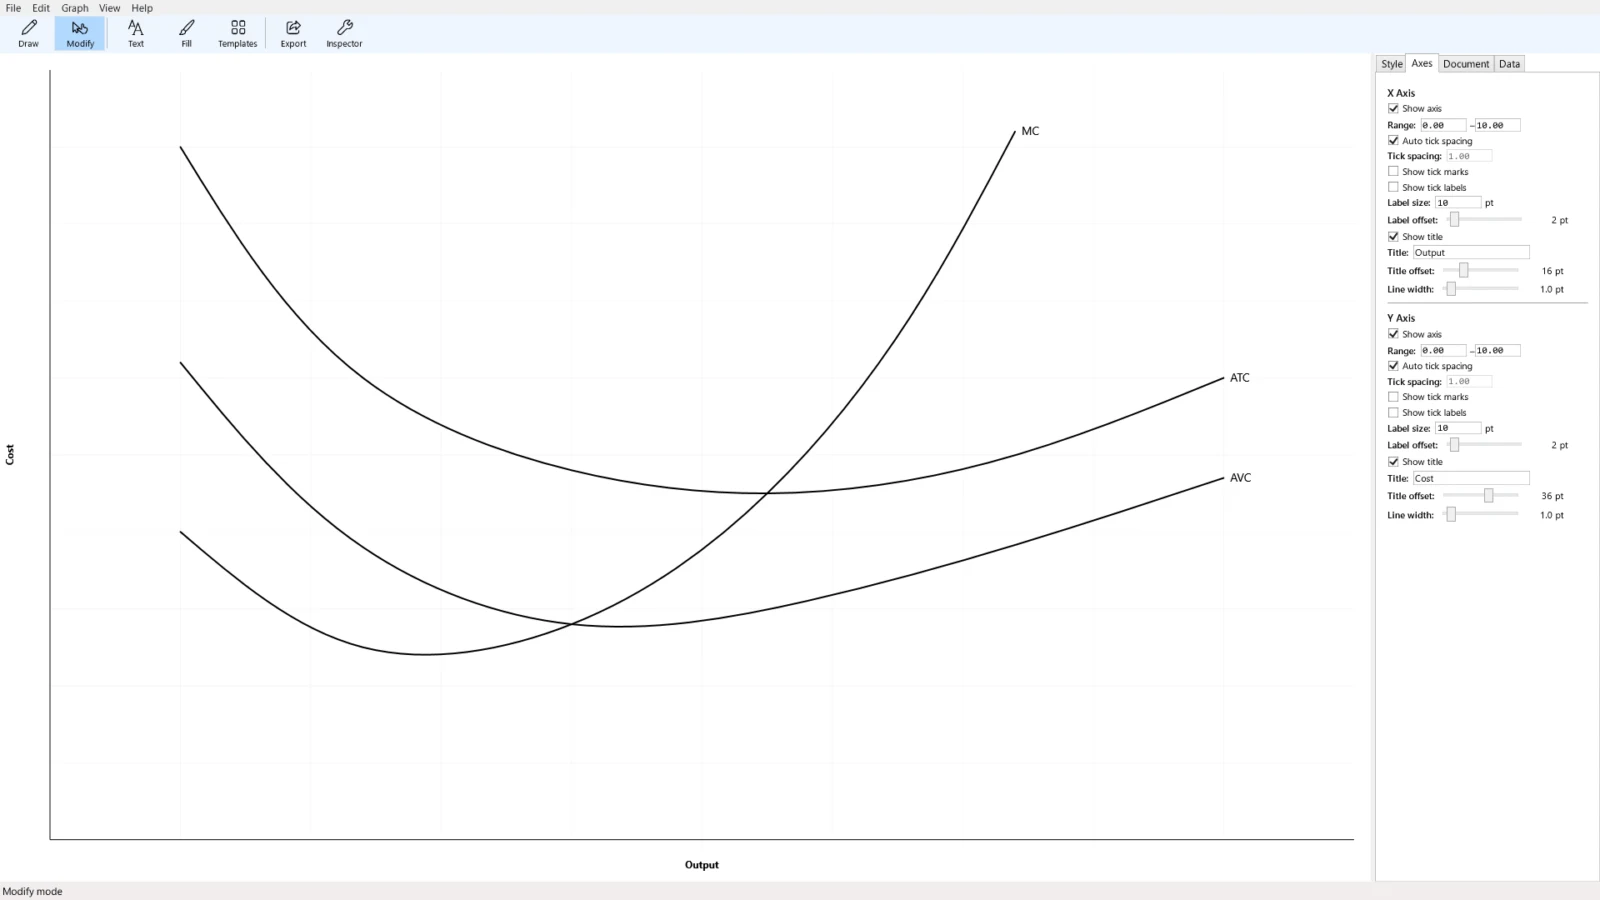
Set up the axes the way you want
You can set the axis range and tick spacing yourself or have them chosen automatically. The axis lines, ticks, tick labels and titles can each be shown or hidden, and you can adjust the size and position of the labels. You can also change the margins, background color and canvas size.
Use numbers only where you need exact values
The “Data” tab in the right panel lists the coordinates of your points in a table. You can double-click a number to change it, or select rows to connect them into a line. Draw by hand most of the time, and match numbers only where you need to.
Export to PDF or images
The export formats are PDF (vector), PNG, JPEG and TIFF, at 2× resolution. A vector PDF keeps lines and text sharp when enlarged, so it suits papers and print. PowerPoint and Word for Windows can’t insert a PDF as a picture, so export a PNG for slides and documents. You can copy and paste elements between documents, and open several documents in separate windows.
Use the same documents as the Mac version
Graph Sketcher for Windows reads and writes documents (.graphsketcher) in the same format as the Mac version. You can go back and forth, for example by editing on a Windows PC a graph you drew on a Mac.
Who is Graph Sketcher for?
Graph Sketcher suits people who need graphs that explain an idea or a shape, rather than graphs that present data.
- Teachers of economics, math and science: use supply and demand, cost curves, parabolas and the normal distribution in lesson slides, handouts and exam questions (how to draw economics graphs, how to draw science graphs)
- Students: draw textbook-style diagrams for reports, seminar presentations and graduation theses
- People who write papers, books or blogs: export to vector PDF so figures stay clean in print
- People who make proposals and presentations: quickly make explanatory figures such as break-even points and product life cycles (how to draw graphs for business documents)
- People who type made-up data into Excel to get a shape: just trace the shape you want instead
- People who use both Mac and Windows: open the same document in either app
On the other hand, for making accurate graphs from measured data, Excel or statistics software is a better fit. Graph Sketcher is not an app for importing data and turning it into graphs.
How much does Graph Sketcher cost, and what does it run on?
Graph Sketcher for Windows lets you try every feature free for the first 7 days. After that, it’s a one-time purchase, not a subscription. The price is shown on the Microsoft Store. The Windows version is purchased separately from the Mac version.
The Windows version runs on x64 PCs with Windows 11 or Windows 10 (version 1809 or later). Its interface is available in Japanese and English only. The Mac version is sold on the Mac App Store, is free for 3 days from first launch, and runs on macOS 14 or later (app page).
Frequently asked questions
Can I use Graph Sketcher on Windows?
Yes. The Windows version of Graph Sketcher is on the Microsoft Store. It runs on x64 PCs with Windows 11 or Windows 10 (version 1809 or later).
Can I try Graph Sketcher for Windows for free?
Yes. You can try every feature free for the first 7 days. After that, it’s a one-time purchase, not a subscription.
Do I need to enter data or equations?
No. Trace a line with a mouse or pen and it becomes a clean straight line or curve, placed on the axes. Where you need exact values, you can also set them with numbers.
Can I open documents from the Mac version in the Windows version?
Yes. Documents (.graphsketcher) use the same format in the Mac and Windows versions, so you can open and save them in either.
If I bought the Mac version, can I also use the Windows version?
No. The Mac version is sold on the Mac App Store and the Windows version on the Microsoft Store, and they are purchased separately.
What formats can I export to?
PDF (vector), PNG, JPEG and TIFF. Graphs are exported at 2× resolution so they stay sharp in slides and documents.
Can Graph Sketcher replace Excel?
It depends on what you need. For concept diagrams that explain a shape, Graph Sketcher is quick. For accurate graphs from measured data, Excel or statistics software is a better fit.
Summary
- Graph Sketcher is an app that turns a traced line into a clean graph, and its Windows version is now on the Microsoft Store
- Its basic features are cleaning up hand-drawn lines, 19 templates, adjusting lines, points, fills, text and axes, and exporting to vector PDF and other formats
- It suits people who need graphs that explain a shape, such as teachers, students, people writing papers or books, and people preparing documents
- The Windows version is free to try for 7 days, then a one-time purchase
→ Learn more about Graph Sketcher