Graph Sketcher is a graphing app for Mac and Windows that turns lines you draw by hand into smooth curves. Use it to draw the schematic diagrams for a bachelor’s or master’s thesis (graphs that show an idea rather than data, such as an inverted U-shaped relationship, an interaction or a trade-off), export them as vector PDFs, and add them to LaTeX with \includegraphics or to Word. Lines and text stay sharp whether you zoom in or print.
Thesis figures include graphs that show measured data and schematic diagrams that show a hypothesis, a model or a trend in the results. Excel, R, Python and similar tools are the reliable way to graph data, but a schematic diagram often has no equation and no data behind it, which makes it hard to know how to draw one. This article walks through drawing a schematic diagram in Graph Sketcher and getting it into your thesis.
| Item | Details |
|---|---|
| Good for | Schematic diagrams of hypotheses, models and trends in results (inverted U-shaped relationships, interactions, trade-offs, growth curves and more) |
| Not suited for | Graphs built from measured data (make these in Excel, R, Python or similar tools) |
| Export formats | PDF (vector), PNG (2× resolution), JPEG, TIFF |
| Adding figures to a thesis | LaTeX: the PDF with \includegraphics; Word on the Mac: the PDF as a picture; Word on Windows: a PNG |
| Requirements (as of November 2026) | Mac (macOS 14 or later), Windows (x64 PCs with Windows 11, or Windows 10 version 1809 or later) |
| Price (as of November 2026) | Free for 3 days from first launch on the Mac and for the first 7 days on Windows, then a one-time purchase (no subscription) |
Thesis diagrams made with Graph Sketcher
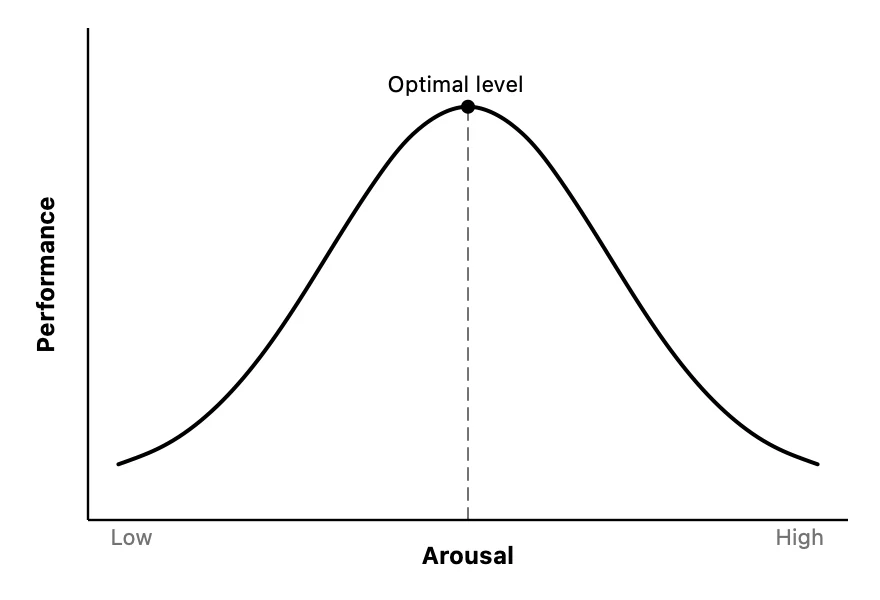
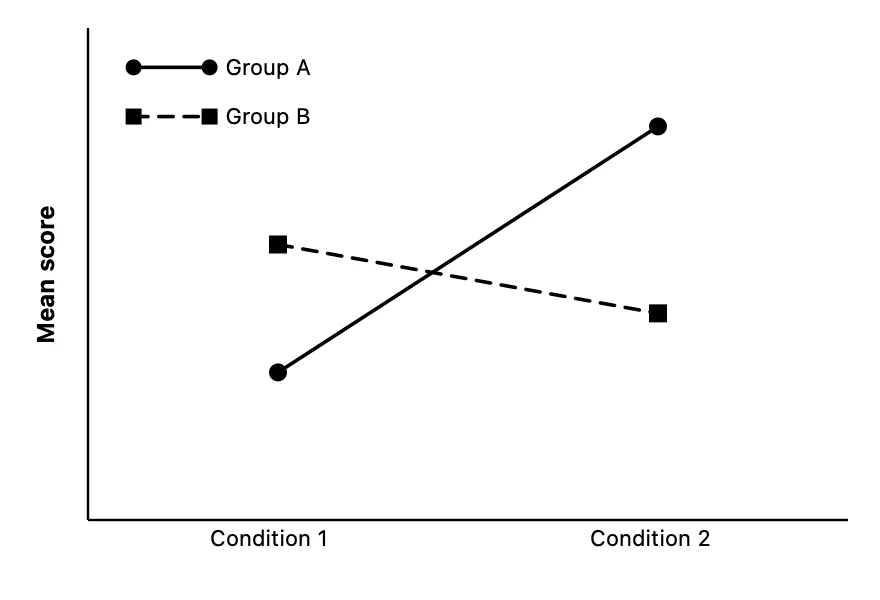
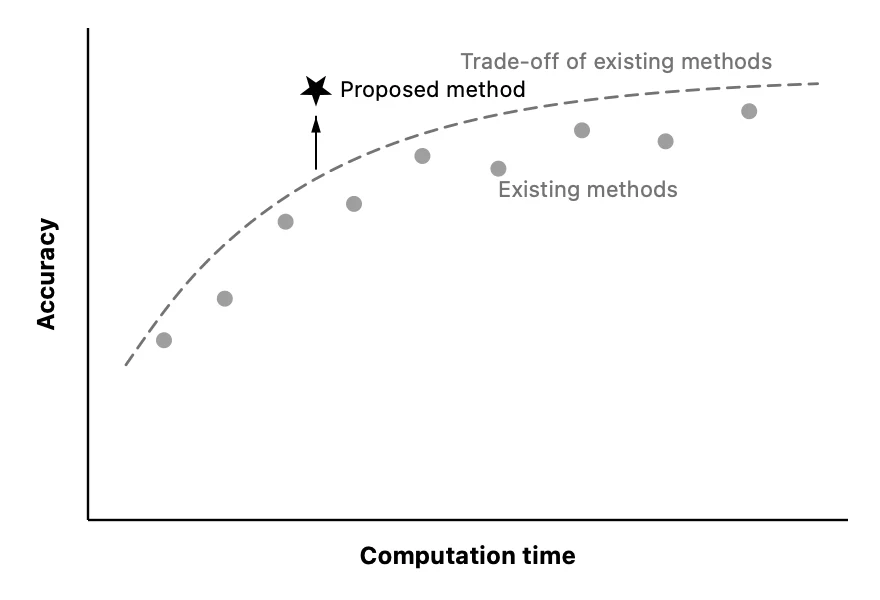
The three figures below were made and exported in Graph Sketcher. So that they can be told apart even when printed in black and white, they use line styles, marker shapes and shades of gray instead of color.
How do you draw a thesis diagram in Graph Sketcher?
1. Set the canvas to the size the figure will be in your thesis
First, decide how big the figure will be. On the Mac, enter the width and height in “Canvas Size (pt)” in the “Document” tab. The exported PDF will be this size. The figures in this article are 440 × 300 pt (about 15.5 × 10.6 cm), close to the text width of an A4 thesis.
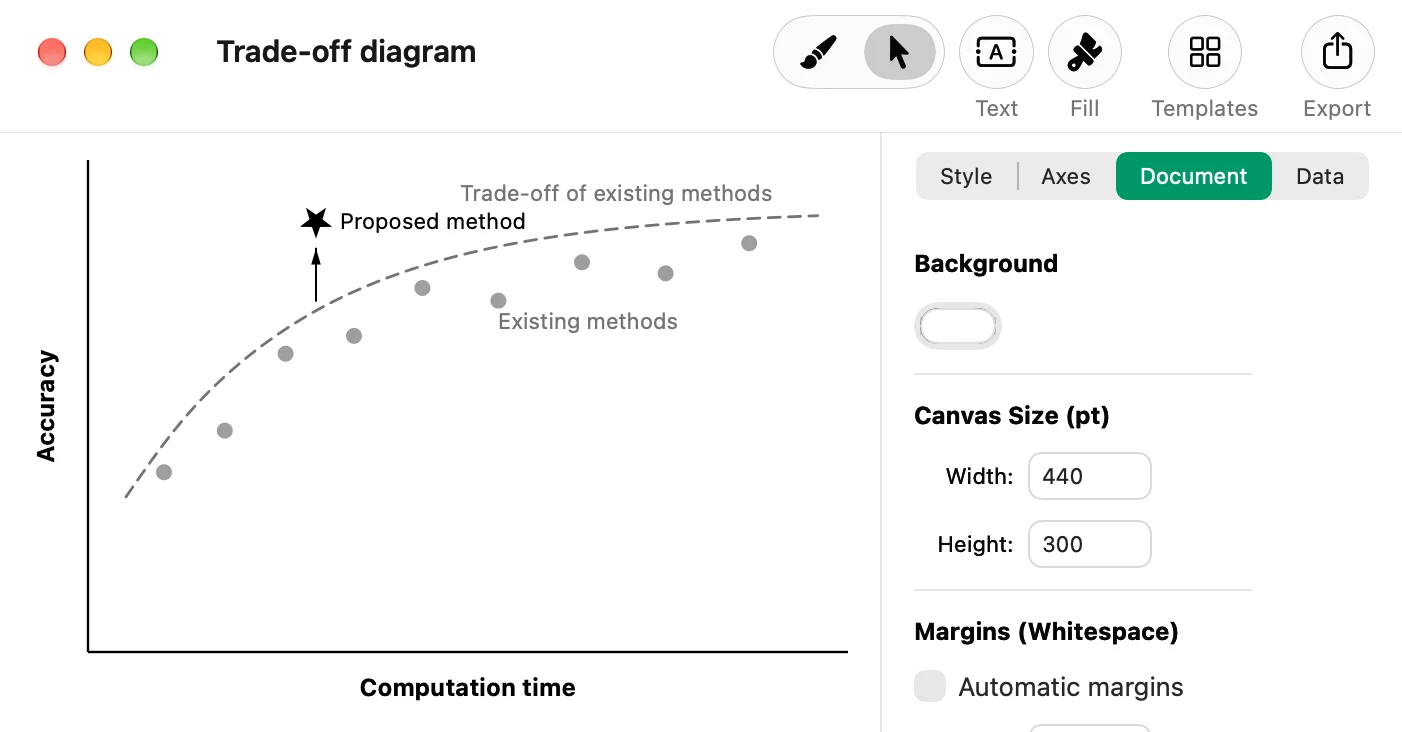
If the canvas is already the size the figure will be in your thesis, you don’t scale the figure when you add it, so the text in it keeps the size (in pt) you set in Graph Sketcher. To match the size of your body text, set the text size in “Style”.
2. Label the axes with words only and remove the ticks
In a schematic diagram, axes without numbers make it clear that the figure shows a trend. In the “Axes” tab, enter the axis titles and turn off “Show tick marks” and “Show tick labels”. The graph draws a light grid at each tick interval, and the grid stays even when the ticks are hidden, so turn off “Auto tick spacing” and set “Tick spacing” to a value larger than the axis range. Place words such as “Low” and “High” at the ends of the axes with “Text”.
3. Draw the curves by hand, then refine their shape
For shapes such as an inverted U or a growth curve, drag with the “Draw” tool and your stroke becomes a smooth curve that keeps the shape you drew. Adjust the position and height of the peak by dragging points with the “Modify” tool. To make a curve symmetrical or to line up the point where lines cross, correct the point coordinates numerically in the “Data” tab.
4. Make it readable in black and white
Theses are sometimes printed in black and white. Distinguish groups and conditions not by color but with solid and dashed lines and marker shapes (circles, squares, triangles and so on). Make guide lines thin, gray and dashed, and give the points you want to highlight a shape that stands out, such as a star, so the figure reads the same in color and in black and white. Build the legend by placing a short line, a marker and text side by side.
How do you add a Graph Sketcher figure to a LaTeX thesis?
Click “Export” in the toolbar, choose PDF as the format and save the file in your thesis’s figures folder. In LaTeX, load it with \includegraphics from the graphicx package.
\usepackage{graphicx}  % preamble

\begin{figure}[tb]
  \centering
  \includegraphics{fig/tradeoff.pdf}
  \caption{Trade-off between computation time and accuracy}
  \label{fig:tradeoff}
\end{figure}
Without a width, \includegraphics places the PDF at its original size. If the canvas is the size the figure will be in your thesis, the text in the figure doesn’t change size either. This works as is with pdfLaTeX and LuaLaTeX. For Japanese documents typeset with upLaTeX (pLaTeX) and dvipdfmx, a common combination for papers in Japanese, specify the driver, as in \usepackage[dvipdfmx]{graphicx}. On Overleaf, upload the PDF to your project and load it the same way.
When we examined PDFs exported by the Mac version of Graph Sketcher, the fonts of the text in the figures were embedded in the PDF. Write the figure’s title in \caption rather than inside the figure, and it appears together with the figure number in your thesis.
How do you add a Graph Sketcher figure to a Word thesis?
In Word on the Mac, you can insert the exported PDF as a picture with “Insert” > “Pictures”.
Microsoft doesn’t describe a way to insert a PDF as a picture in Word on Windows, so export a PNG and insert that. PNGs are exported at twice the resolution of the canvas. If you want a finer image for printing, make the canvas twice the size the figure will be in your thesis, draw the text and lines twice as large too, and shrink the image to half its size in Word. For a figure 440 pt wide, that gives about 290 dpi.
Can you use Graph Sketcher figures on conference presentation slides too?
Yes. Place the PDF as is in PowerPoint on the Mac, and a PNG in PowerPoint on Windows, Keynote and Google Slides. Because you export from the same document as for your thesis, the figures look the same in your thesis and your presentation. How to place them on slides is covered in the article on drawing curved graphs in PowerPoint.
How do you revise a figure after comments from your thesis advisor?
Keep not only the exported PDF but also the Graph Sketcher document (.graphsketcher) together with your thesis files. To revise a figure, open the document, make your changes and export the PDF again under the same file name; in LaTeX, the new figure replaces the old one at the next compile. The Mac version keeps versions of your documents automatically, so you can also go back to how the figure looked before your changes.
What are Graph Sketcher’s price and requirements?
Graph Sketcher is available on the Mac App Store and the Microsoft Store. Every feature is free for 3 days from first launch on the Mac and for the first 7 days on Windows, then it’s a one-time purchase. There is no subscription. The Mac version requires macOS 14 or later, and the Windows version runs on x64 PCs with Windows 11 or Windows 10 (version 1809 or later). The Windows version’s interface is available in Japanese and English.
Frequently asked questions
Can Graph Sketcher make graphs from measured data?
Graph Sketcher is not an app that imports data and turns it into graphs. It works best to make graphs of measured data in Excel, R, Python or similar tools, and to draw schematic diagrams of hypotheses and trends in Graph Sketcher. For a few points, you can place coordinates numerically in the “Data” tab.
Can I use Graph Sketcher PDFs in LaTeX?
Yes. The vector PDFs that Graph Sketcher exports can be loaded with \includegraphics from the graphicx package. If you don’t specify a width, they are placed at their original size.
Can I match the text size in a figure to my thesis?
Yes. If you set the Graph Sketcher canvas to the size (in pt) the figure will be in your thesis, the text in the figure keeps the size you set in Graph Sketcher when you add the figure without scaling it.
Can Graph Sketcher figures be told apart when printed in black and white?
Yes. Make the lines black or gray and distinguish them with solid and dashed lines and marker shapes (circles, squares, triangles and so on), and they can be told apart even when printed in black and white.
Can I use it for figures in a paper written in English?
Yes. You can type any text you like in a figure, so you can make figures for papers in English too. The Mac version’s interface is also available in 37 languages.
Is Graph Sketcher free?
You can try every feature of Graph Sketcher free for 3 days from first launch on the Mac and for the first 7 days on Windows. After that it’s a one-time purchase, with no subscription.
Summary
- Graph Sketcher is a Mac and Windows app for drawing schematic diagrams for a bachelor’s or master’s thesis and exporting them as vector PDFs
- Set the canvas to the size (in pt) the figure will be in your thesis, and the text in the figure keeps its size
- In LaTeX, add the PDF with \includegraphics; in Word on the Mac, insert the PDF as a picture; in Word on Windows, use a PNG
- To keep figures readable in black and white, distinguish elements by line style and marker shape instead of color
→ Learn more about Graph Sketcher