Graph Sketcher is a graphing app for Mac and Windows that joins hand-drawn lines and points placed by number with smooth curves. You can draw math graphs such as the parabola of a quadratic function or the hyperbola of inverse proportion at the exact coordinates from the problem, label the intersections, shade the region in question, and export a PDF or PNG to paste into worksheets and tests.
When you make a math worksheet, the graphs are the time-consuming part. Besides the right shape, a figure for a problem needs the right presentation: only the coordinates of the vertex and intersections written in, the region to find shaded, guide lines dashed. This article takes four figures common in middle and high school math and shows how to make them in Graph Sketcher.
| Item | Details |
|---|---|
| Best suited for | Function graphs for worksheets, tests and lesson slides: parabolas, lines, hyperbolas, trigonometric functions, area figures and more |
| Setting coordinates | Draw by hand, or type point coordinates as numbers in the “Data” tab. A curve becomes a smooth line through every point you place |
| Math templates | 7 in all: linear function, quadratic function, inverse proportion, sine wave, exponential growth, logistic growth and normal distribution |
| Export formats | PDF (vector), PNG (2× resolution), JPEG, TIFF |
| Requirements (as of November 2026) | Mac (macOS 14 or later), Windows (x64 PCs with Windows 11, or Windows 10 version 1809 or later) |
| Price (as of November 2026) | Free for 3 days from first launch on the Mac and for the first 7 days on Windows, then a one-time purchase (no subscription) |
Math graphs made with Graph Sketcher
Every figure in this article was made and exported in Graph Sketcher. Worksheets are often printed in black and white, so apart from the quadratic function, the figures use black lines and gray fills with no color.
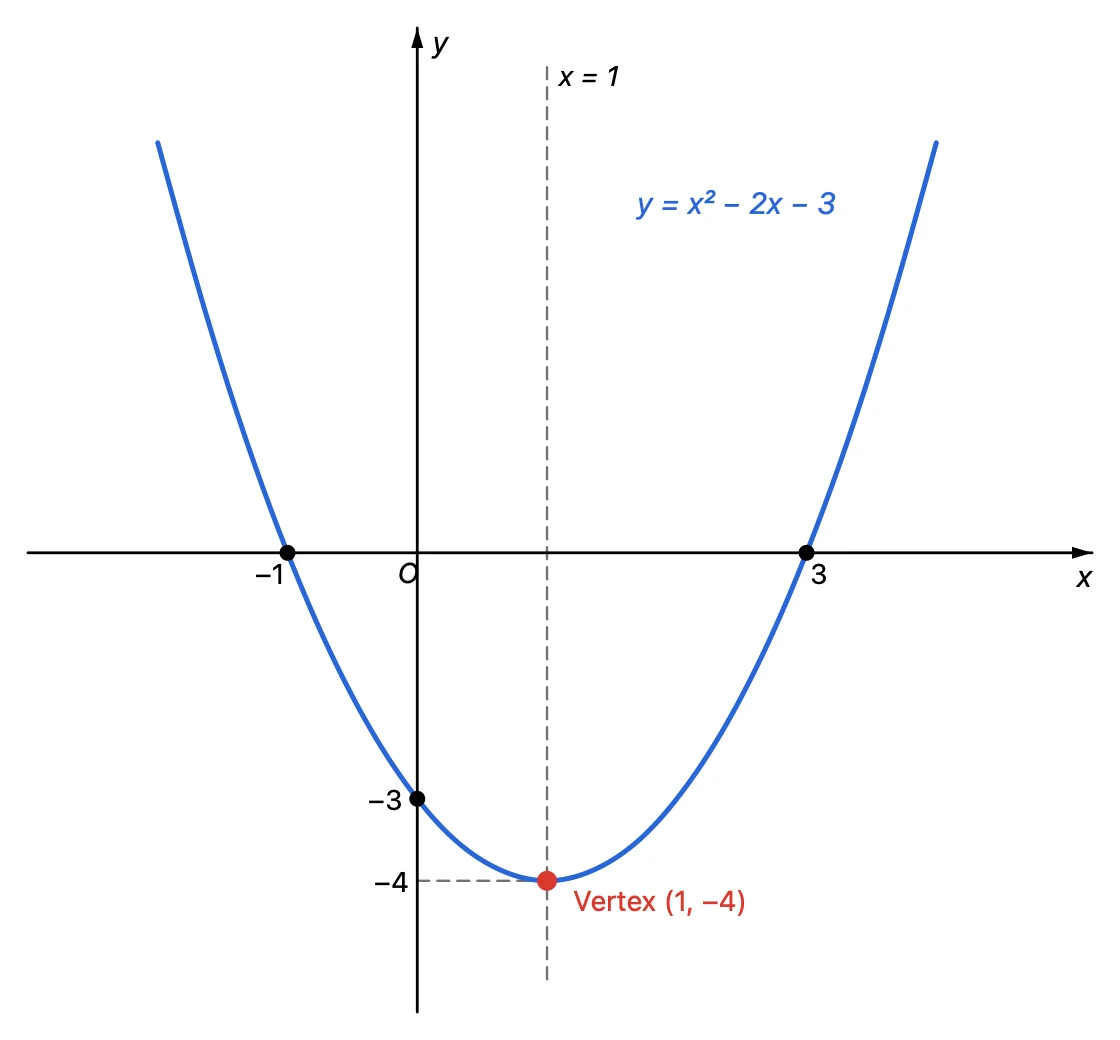
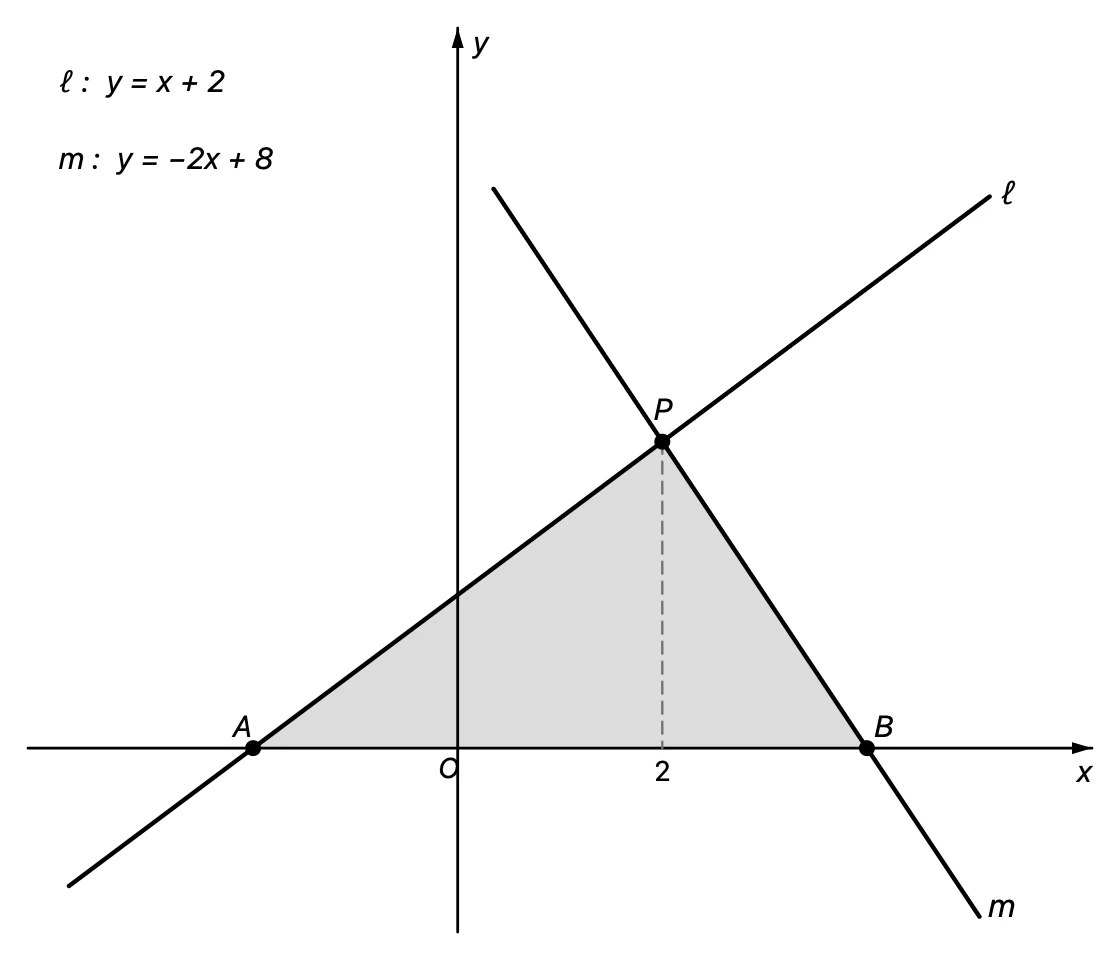
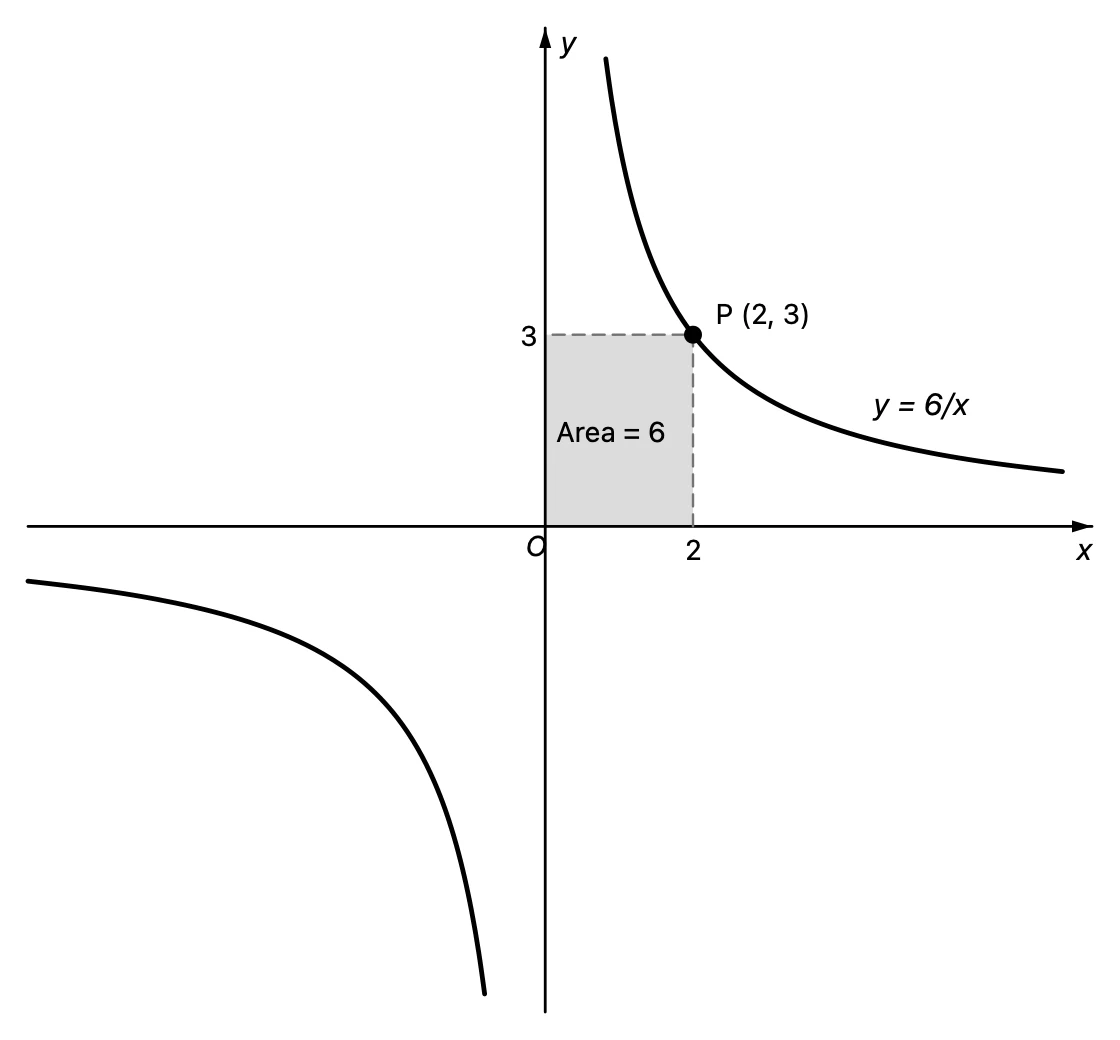
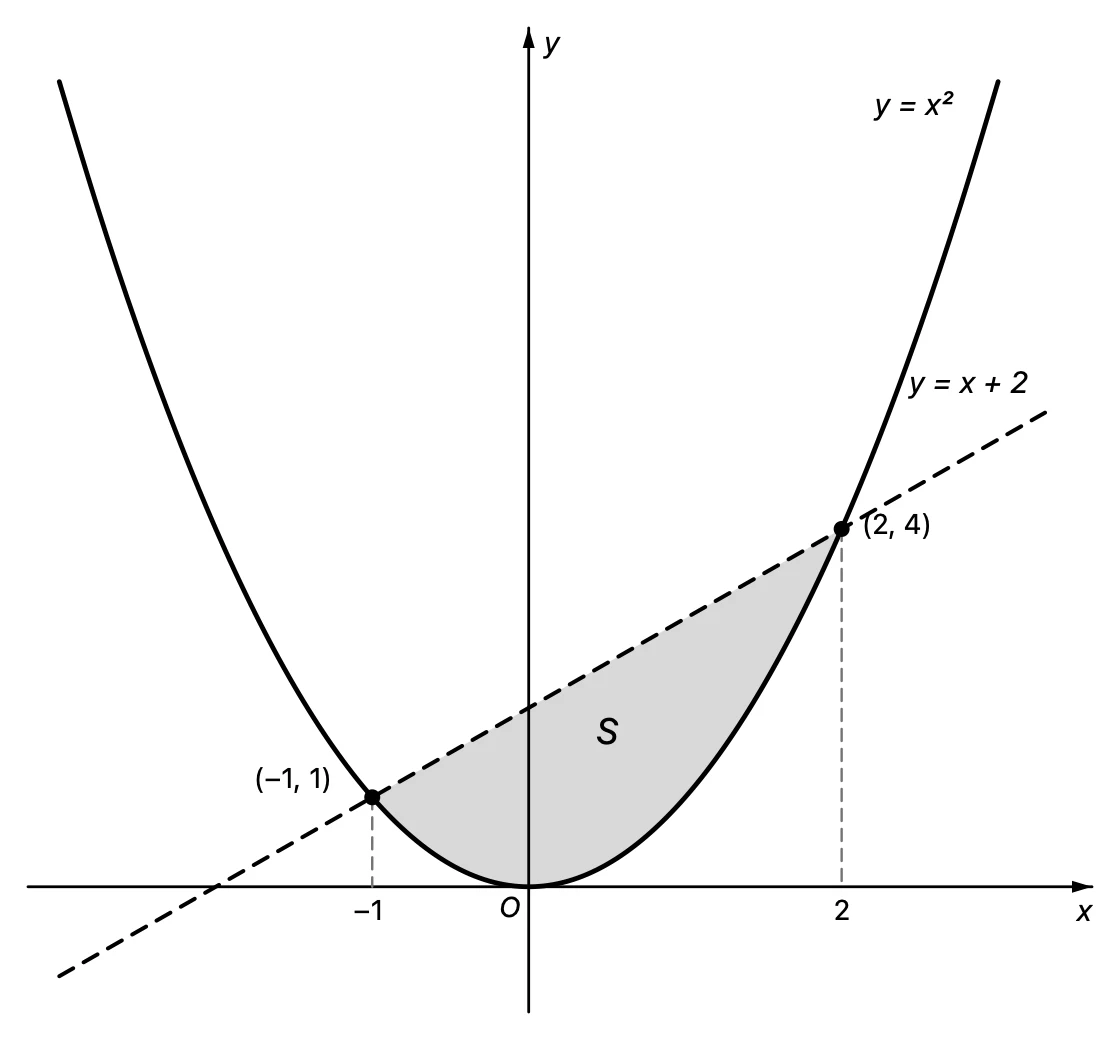
How do you make math graphs in Graph Sketcher?
1. Draw axes that cross at the origin as lines with arrows
Graph Sketcher draws its axes along the left and bottom of the graph. That works as is for a figure in the first quadrant only, but a function graph with negative values needs coordinate axes that cross at the origin. In that case, turn off “Show axis” in the “Axes” tab and draw the x-axis and y-axis as straight lines with an arrow at the end. Place the letters “x”, “y” and “O” with “Text” and set them in italics.
2. Place the points of a curve by number
In the “Data” tab, you can type point coordinates as numbers. For y = x² − 2x − 3, for example, place points with x in steps of 0.5 (x = −2, −1.5, …, 4), select the rows and click “Connect” to make a line. The new line joins the points with straight segments, so switch “Connection” to “Curved” in “Style”. The curve is a smooth line through every point you placed, so it passes through the vertex and intersections exactly where the equation puts them.
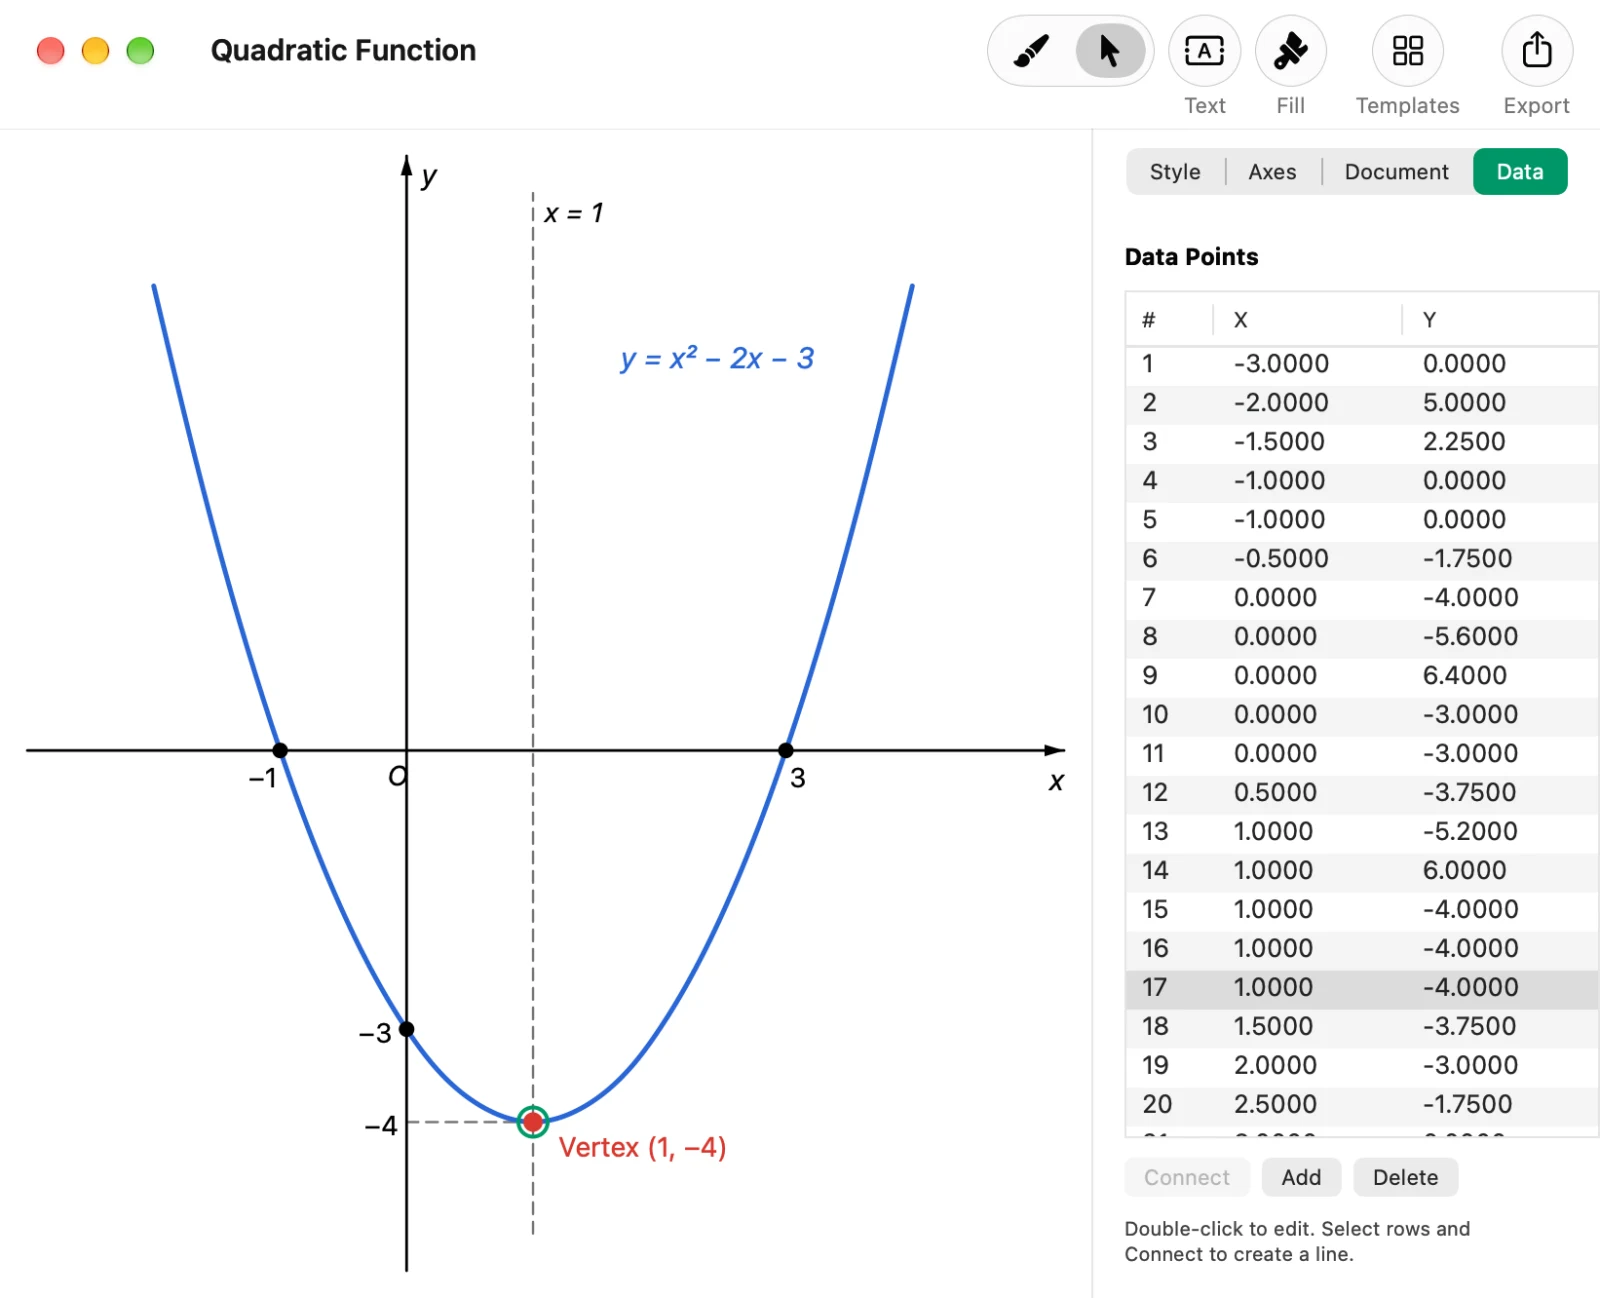
You can also change the coordinates of a hand-drawn curve as numbers afterward. Another way is to start from the “Quadratic Function” template and move the vertex to the values in the problem (article on templates).
3. Place points and labels at intersections and vertices
In “Style”, you can choose the shape (circle, square and so on) and size of a point. Place labels such as “Vertex (1, −4)”, “A” and “P (2, 3)” anywhere you like with “Text”. Setting point names in italics makes the figure look closer to a textbook.
4. Shade the region to find
Shade the area of a triangle or a region enclosed by curves with “Fill”. Enclose the region with a single closed line and click inside it. On a worksheet printed in black and white, a light gray makes clear which region to find while the lines and text on top stay easy to read.
5. Dash the guide lines and remove the grid you don’t need
Make guide lines, such as the axis of symmetry x = 1 or the lines dropped from a point to the coordinate axes, thin and dashed in “Style”. The graph draws a faint grid at the tick spacing. The grid stays even when you hide the tick marks, so for a figure without a grid, turn off “Auto tick spacing” in the “Axes” tab and set the tick spacing to a value larger than the axis range (for example, 100).
How do you put the graphs on worksheets and tests?
Click “Export” in the toolbar and choose PDF or PNG as the format. A PDF is a vector file at the size of the canvas, and a PNG is an image at twice that resolution.
- In Word on the Mac, you can insert the PDF as a picture as is
- For Word on Windows and Google Docs, export a PNG and paste it in (neither documents a way to insert a PDF as a picture)
- If you make worksheets in LaTeX, you can load the PDF as is with
\includegraphics - Set the size of each figure with the Graph Sketcher canvas size rather than shrinking it after pasting, and the text size stays the same from figure to figure
When you want the same kind of problem with different numbers, duplicate the Graph Sketcher document, change the coordinates in the “Data” tab and export again. You can make quizzes and similar problems with the same line widths and text sizes. How to put graphs on lesson slides is covered in the article on drawing curved graphs in PowerPoint, and science figures in the article on science graphs.
When should you use GeoGebra or Desmos, and when Graph Sketcher?
To draw exact graphs from equations, or to change values and show in class how a graph changes, function graphing tools such as GeoGebra and Desmos are the better fit. Graph Sketcher is not a tool that draws graphs from equations. It’s an app for finishing figures for worksheets and tests: you make the shape exact by typing coordinates as numbers, then decide freely which points to label, which region to shade and which lines to dash.
What does Graph Sketcher cost, and what does it run on?
Graph Sketcher is available on the Mac App Store and the Microsoft Store. Every feature is free for 3 days from first launch on the Mac and for the first 7 days on Windows, then it’s a one-time purchase. There is no subscription. The Mac version runs on macOS 14 or later, and the Windows version on x64 PCs with Windows 11 or Windows 10 (version 1809 or later). The Windows version’s interface is available in Japanese and English only.
Frequently asked questions
Can Graph Sketcher draw a graph automatically from an equation?
No. Graph Sketcher is not an app that draws graphs from equations you type in. You draw curves by hand, or type point coordinates as numbers in the “Data” tab and join them with a smooth line. Place the points closely enough and the shape matches the equation.
Can Graph Sketcher draw coordinate axes that cross at the origin?
Yes. Graph Sketcher draws its axes along the left and bottom of the graph, so for axes that cross at the origin, hide the axes in the “Axes” tab and draw the x-axis and y-axis as straight lines with arrows.
Can you tell Graph Sketcher graphs apart when they are printed in black and white?
Yes. Make the lines black and tell them apart with solid and dashed lines, point shapes (circle, square and so on) and light gray fills, and they stay distinguishable in black and white.
Can I paste a graph made in Graph Sketcher into a Word worksheet?
Yes. In Word on the Mac, you can insert a PDF exported from Graph Sketcher as a picture. For Word on Windows, export a PNG and paste it in.
Is Graph Sketcher free?
You can try every feature of Graph Sketcher free for 3 days from first launch on the Mac and for the first 7 days on Windows. After that, it’s a one-time purchase, with no subscription.
Summary
- Graph Sketcher is a Mac and Windows app for making graphs for math worksheets and tests at exact coordinates, with the presentation you want
- Type the coordinates of a curve in the “Data” tab and it passes through the vertex and intersections exactly where the equation puts them
- Draw axes that cross at the origin as straight lines with arrows, and shade the region to find in gray
- Export as PDF (vector) or PNG. Use PDF for Word on the Mac, and PNG for Word on Windows and Google Docs
→ Learn more about Graph Sketcher