To draw a curve in PowerPoint, click “Shapes” on the “Insert” tab, choose “Curve” under “Lines”, click at each point where you want the line to bend, and double-click to finish. That’s all it takes to draw a single curve.
But when you try to draw a graph with axes, intersections and fills, lining up the points and getting the bends right takes a lot of work. Graphs like that are quicker to finish in Graph Sketcher, a Mac and Windows app that turns lines you draw by hand into smooth curves: draw the graph there, export it as a PDF or PNG and paste it in. This article explains how to use PowerPoint’s “Curve” tool, and how to draw a graph in Graph Sketcher and paste it into your slides.
| Item | Details |
|---|---|
| Where to draw a curve in PowerPoint | “Insert” tab → “Shapes” → “Curve” under “Lines” |
| How to finish a curve | Double-click for an open line; click near the starting point for a closed shape |
| How to fix a curve’s shape | “Shape Format” tab → “Edit Shape” → “Edit Points” |
| Graphs with axes or fills | Draw them in Graph Sketcher (Mac and Windows), then paste them as a PDF into PowerPoint on the Mac or as a PNG into PowerPoint on Windows |
| Graph Sketcher price (as of November 2026) | Free for 3 days from first launch on the Mac and for the first 7 days on Windows, then a one-time purchase (no subscription) |
How do you draw a curve with PowerPoint’s “Curve” tool?
- Click “Shapes” on the “Insert” tab and choose “Curve” under “Lines”
- Click where you want the curve to start
- Click at each point where you want the line to bend, adding points as you go
- To finish with an open curve, double-click. To make a closed shape, click near the starting point
To fix the shape after drawing, select the curve and choose “Edit Points” from “Edit Shape” on the “Shape Format” tab. Drag a vertex to move it, or drag the handles that extend from a vertex to change how the line bends.
Under “Lines” you’ll also find “Freeform: Shape”, which you draw by combining clicks and drags, and Scribble, a freehand tool that draws the line exactly as you drag. Because Scribble follows your drag exactly, a clean curve is hard to draw with a mouse; for a smooth curve, “Curve” is the better choice.
Where does drawing graph curves in PowerPoint take extra work?
For a single decorative curve, “Curve” is all you need. When you try to draw a graph, these are the places where it takes extra work.
- Hard to align with the axes: a curve’s points are set by their position on the slide, so placing them to fit the axes, such as “y is 4 when x is 2”, comes down to eyeballing
- Hard to set where curves cross: making two curves cross at a point you choose is difficult
- Hard to fill areas: to fill the area under a curve, you have to draw a separate closed shape that follows the curve
- Slow to revise: every time you change the shape, you move the vertices and handles one by one
- Lots of parts: the axes, guide lines, text and arrows have to be laid out as separate shapes and grouped together
If your graph has data behind it, you can draw it with Excel’s “Scatter with Smooth Lines” chart. But explanatory graphs such as a J-curve or a supply and demand diagram almost never have data behind them.
How do you draw a graph in Graph Sketcher and paste it into PowerPoint?
1. Draw lines by hand and they become smooth curves
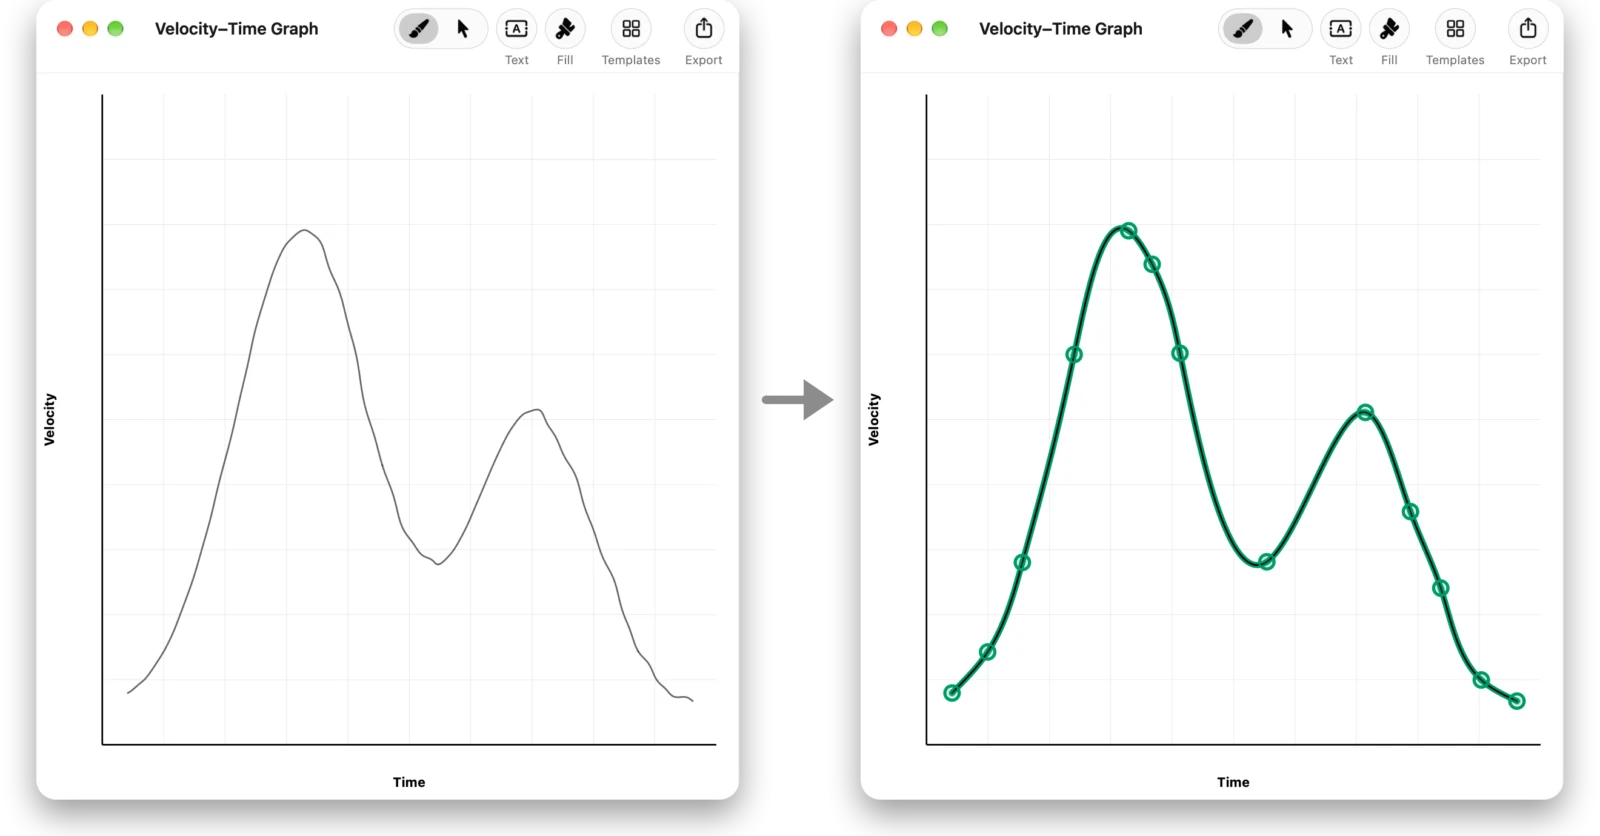
Drag across the canvas with Graph Sketcher’s “Draw” tool, and it reads the corners and bends of your stroke and rebuilds it as a smooth curve that keeps the shape you drew. The curve is made of only a few points, so it’s easy to adjust the shape later.
2. Set up the axes, guide lines, fills and text
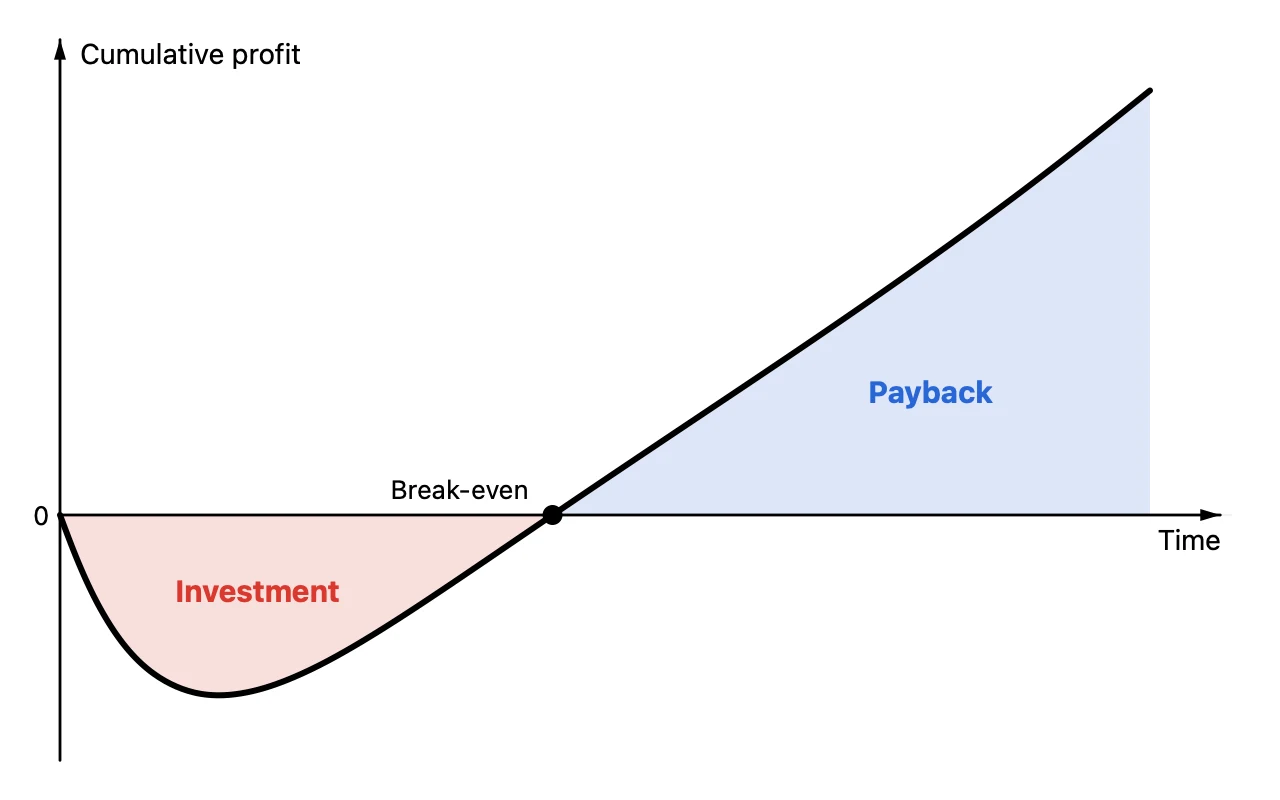
Refine the curve by dragging its points with the “Modify” tool. Change the axis range and ticks in the “Axes” tab, and the line color, width, dashes and arrows in “Style”. To fill the area under a curve, enclose the part you want to fill with a closed line, then click inside it with “Fill”. To set exactly where curves cross, enter the point coordinates as numbers in the “Data” tab. Common graphs such as supply and demand can start from one of the 19 templates.
3. Export it and paste it into PowerPoint
Choose a format with “Export” in the toolbar, save the file and paste it into PowerPoint.
- PowerPoint on the Mac: export a PDF, choose “Insert” → “Picture” → “Picture from File” and select the PDF; it goes in as a picture
- PowerPoint on Windows: export a PNG and paste it from “Pictures” on the “Insert” tab. Microsoft doesn’t describe a way to insert a PDF as a picture in PowerPoint on Windows. PNGs are exported at twice the resolution of the canvas
- Keynote and Google Slides: export a PNG and paste it in
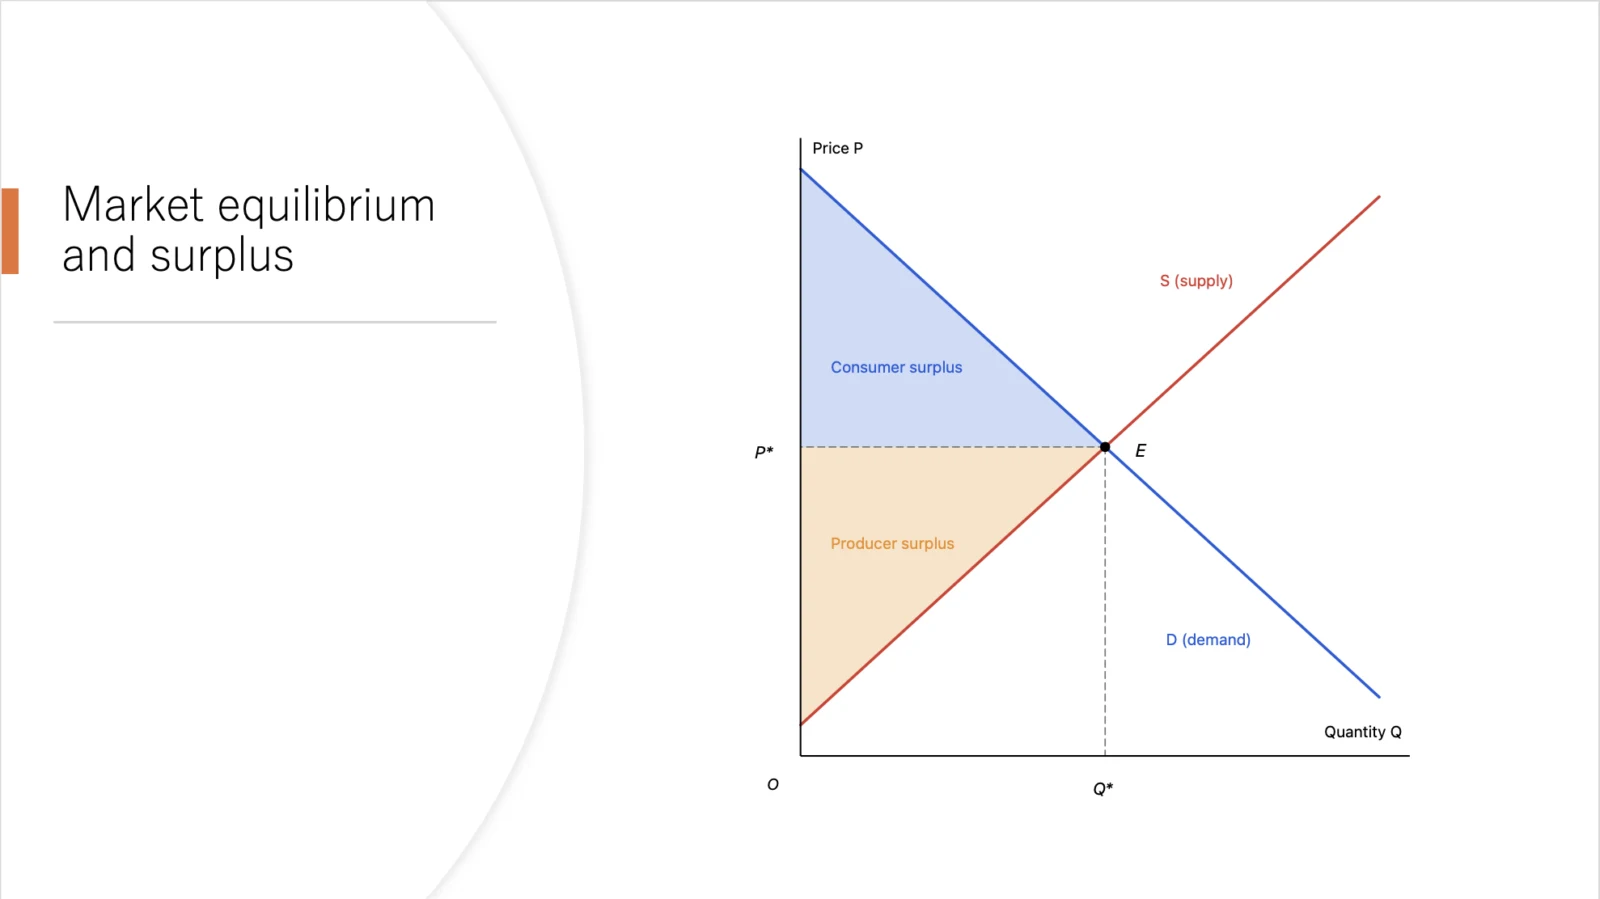
For a figure on a slide, set the Graph Sketcher canvas close to the size it will have on the slide; then the text won’t get too small even if you shrink the figure after pasting it. The same steps, with economics graphs as examples, are also in the article on economics graphs.
4. After editing the graph, swap it in with “Change Picture”
Keep the Graph Sketcher document (.graphsketcher), and you can change the shape later. After editing it and exporting again, select the picture on the slide in PowerPoint and choose the new file from “Change Picture” on the “Picture Format” tab. The picture keeps its size and position; only its contents are replaced.
How do you draw a curve in Keynote?
In Keynote, click “Shape” in the toolbar and choose “Draw with Pen”. Click to add points; click and drag to make a curved line. Click the starting point to close the shape, or press Return or Esc to finish with an open line. Drawing a graph runs into the same snags as in PowerPoint, so graphs with axes and fills are quicker to finish if you draw them in Graph Sketcher and paste them in.
When should you use PowerPoint, Excel or Graph Sketcher?
| Method | Good for | Not suited for |
|---|---|---|
| PowerPoint’s “Curve” | A single curve, decorations and arrows in figures | Graphs with axes, intersections and fills |
| Excel charts | Graphs with data | Explanatory graphs without data |
| Graph Sketcher | Explanatory graphs with axes, curves, intersections and fills | Graphs built from lots of data |
Function graphs for class handouts are covered in the article on math graphs, and schematic diagrams for papers in the article on thesis diagrams.
What are Graph Sketcher’s price and requirements?
Graph Sketcher is available on the Mac App Store and the Microsoft Store. Every feature is free for 3 days from first launch on the Mac and for the first 7 days on Windows, then it’s a one-time purchase. There is no subscription. The Mac version requires macOS 14 or later, and the Windows version runs on x64 PCs with Windows 11 or Windows 10 (version 1809 or later). The Windows version’s interface is available in Japanese and English.
Frequently asked questions
How do you draw a curve in PowerPoint?
In PowerPoint, click “Shapes” on the “Insert” tab and choose “Curve” under “Lines”. Click at each point where you want the line to bend, and double-click to finish. Clicking near the starting point makes a closed shape.
Can you change the shape of a curve drawn in PowerPoint afterwards?
Yes. Select the curve and choose “Edit Points” from “Edit Shape” on the “Shape Format” tab, then drag the vertices and handles to change the shape.
How do you fill the area under a curve in PowerPoint?
In PowerPoint, you draw a separate closed shape that follows the curve and fill that. In Graph Sketcher, enclose the part you want to fill with a closed line and click inside it with “Fill”.
Can you paste a graph drawn in Graph Sketcher into PowerPoint on Windows?
Yes. Export it from Graph Sketcher as a PNG and paste it from “Pictures” on the “Insert” tab. PNGs are exported at twice the resolution of the canvas. In PowerPoint on the Mac, you can insert a PDF as a picture.
Is Graph Sketcher free?
You can try every feature of Graph Sketcher free for 3 days from first launch on the Mac and for the first 7 days on Windows. After that it’s a one-time purchase, with no subscription.
Summary
- To draw a curve in PowerPoint, choose “Insert” → “Shapes” → “Curve” under “Lines”, click at each point where you want the line to bend, and double-click to finish
- You can fix the shape with “Shape Format” → “Edit Shape” → “Edit Points”
- Graphs with axes, intersections and fills are quicker to finish if you draw them in Graph Sketcher (Mac and Windows) and paste them in
- Paste a PDF into PowerPoint on the Mac, and a PNG into PowerPoint on Windows, Keynote and Google Slides; after editing, swap the figure in with “Change Picture”
→ Learn more about Graph Sketcher