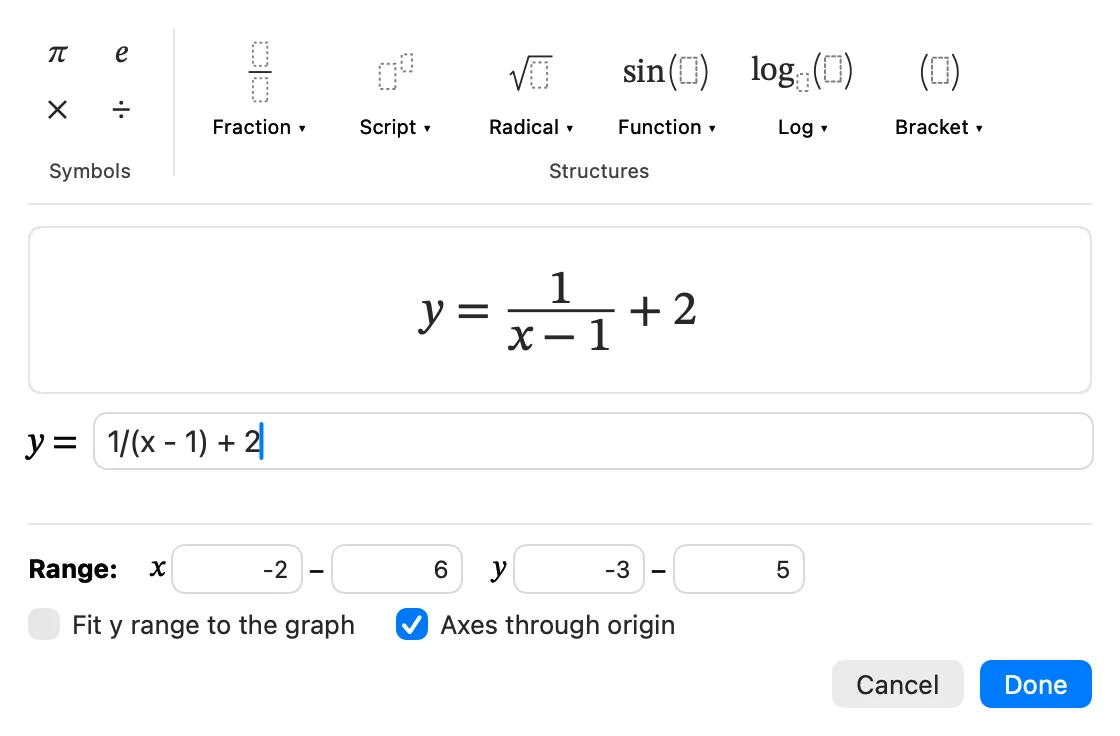
Version 2.3 of Graph Sketcher can draw an exact graph of a function from an equation you type in. Build an equation such as x^2 – 2x – 3, sin 2x or 1/(x – 1) + 2 in an editor similar to the equation editor in Word, and the graph is drawn as you type. A new setting also draws the coordinate axes as number lines that cross at the origin.
Until now, Graph Sketcher was an app for making figures that explain a shape, by smoothing hand-drawn lines into clean curves. From 2.3, you can draw an exact curve from an equation, then finish the figure by adding guide lines, points and text by hand. That greatly widens what you can use it for, from math teachers in middle school, high school and university to people who write math teaching materials and papers. This article reviews the basics of function graphs and shows how to use the new “Function” feature.
| Item | Details |
|---|---|
| New features (2.3) | “Function”, which draws a function graph from an equation. “Cross at 0”, which makes the coordinate axes number lines that cross at the origin. “Fit y range to the graph”, which sets the y range automatically |
| Functions it can draw | Functions of the form y = f(x): polynomials, rational functions, radical functions, trigonometric functions, exponential functions, logarithmic functions, hyperbolic functions, absolute value, the floor function and more |
| Entering equations | One-line input such as x^2 – 1, plus fill-in structures for fractions, superscripts, radicals, functions, logarithms and brackets |
| How it draws | Calculates closely spaced points across the full axis range, and breaks the line accurately at the ends of the domain and on either side of an asymptote |
| Combining | Can go in the same document as hand-drawn lines, points, text and fills, and the 19 templates |
| Export formats | PDF (vector), PNG, JPEG, TIFF |
| Requirements (as of November 2026) | Mac (macOS 14 or later), Windows (x64 PCs with Windows 11, or Windows 10 version 1809 or later) |
| Price (as of November 2026) | Free for 3 days from first launch on the Mac and for the first 7 days on Windows, then a one-time purchase (no subscription) |
What is the graph of a function?
A function y = f(x) is a rule that gives exactly one value of y for each value of x. For f(x) = x², for example, y = 4 when x = 2, and y = 9 when x = −3. If you change x little by little, plot the points (x, f(x)) and join them, you get the graph of the function.
A graph makes visible the properties that are hard to see from the equation alone. In class, we draw function graphs to get across points such as these.
- Increasing and decreasing: how y changes as x increases, and where it reaches a maximum or minimum
- x-intercepts: the values of x where f(x) = 0, that is, the solutions of the equation
- Domain: the values of x for which the function is defined. For √x, it is x ≥ 0
- Asymptotes: lines that the graph gets closer and closer to but never meets
- Period: the interval at which the same shape repeats. For sin x, it is 2π
- Translation and stretching: how the graph moves when you change the numbers in the equation
When you draw a graph by hand, you calculate a few points and join them smoothly. Graph Sketcher 2.3 does this calculation every 0.5 pt on screen and draws across the full range of the axes. Where the function is undefined, as with √x for x < 0, or where its value jumps, as with tan x, it breaks the line and pins down the position of each end precisely, so the graph is exact right up to its ends and on both sides of an asymptote.
How do you draw a function graph in Graph Sketcher?
- Click “Function” in the toolbar
- Type the equation. You don’t need to write “y =”. For fractions and powers, you can also insert a structure with blanks from the “Structures” buttons at the top. Press the Tab key to move to the next blank (□)
- Set the x and y ranges under “Range”. You can also enter expressions such as 2π. Select “Fit y range to the graph” to set the y range automatically
- To make the coordinate axes number lines that cross at the origin, select “Axes through origin”
- Click “Insert”
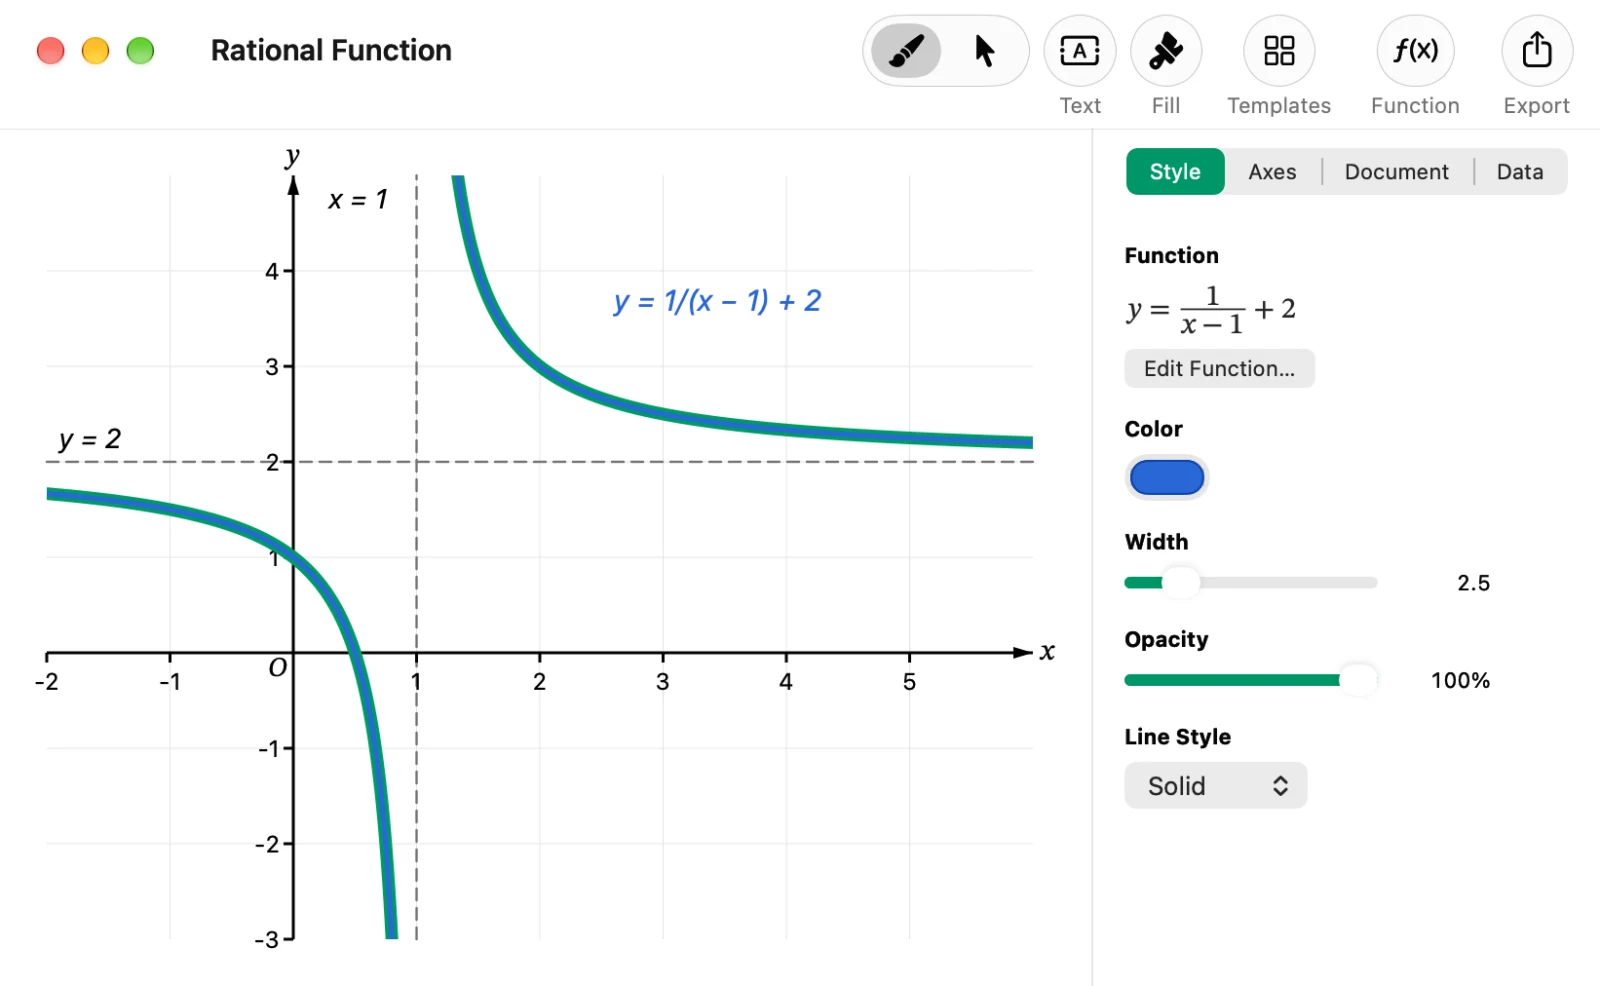
In an empty document, the x and y ranges start at −10 to 10, with the coordinate axes through the origin. Just as with a hand-drawn line, you can change a function graph’s color, width, opacity and line style (solid, dashed, double), and copy and paste it. To change the equation, double-click the graph or click “Edit Function…” in “Style”.
How to write equations
You type equations on one line, in much the same way as in the equation editor in Word.
| Equation | What to type |
|---|---|
| x², x³ | x^2, x^3 (superscript digits as in x² are also recognized) |
| 1/(x − 1) + 2 | 1/(x – 1) + 2 |
| √x, ∛x | sqrt(x) or √x, cbrt(x) |
| sin 2x, cos(x − π/3) | sin 2x, cos(x – π/3) |
| eˣ, 2ˣ | e^x, 2^x |
| log₂ x, log x, ln x | log_2(x), log(x) (common logarithm), ln(x) |
| |x|, ⌊x⌋ | |x|, floor(x) |
| π | π or pi |
- You can leave out the multiplication sign (3x, 2 sin x)
- As in Word, 1/2x is read as 1/(2x), and e^2x as e^(2x). If you mean x/2, write x/2 or (1/2)x
- Full-width digits and symbols are also recognized
- The letters you can use are x, π and e. Letters such as a and b (parameters) can’t be used
Function graphs by example
Each of the figures below was drawn from equations in Graph Sketcher 2.3, finished with guide lines and text added by hand, and exported.
y = ax²: the value of a changes how wide the parabola opens and which way (middle school)
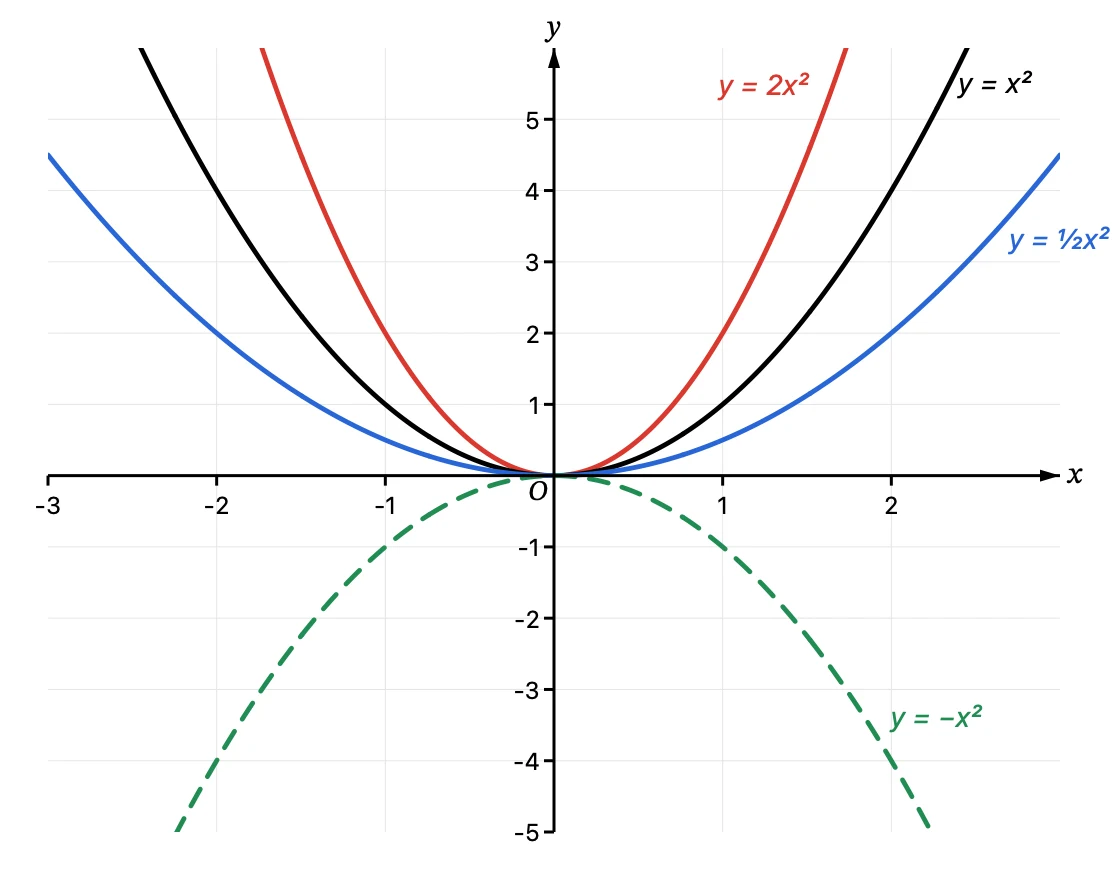
The graph of y = ax², which students meet in middle school, is a parabola with its vertex at the origin. It opens upward when a > 0 and downward when a < 0, and the larger the absolute value of a, the narrower it is. Draw several equations on the same coordinate plane in different colors and line types, and the effect of a is clear at a glance.
Rational functions and asymptotes (high school)
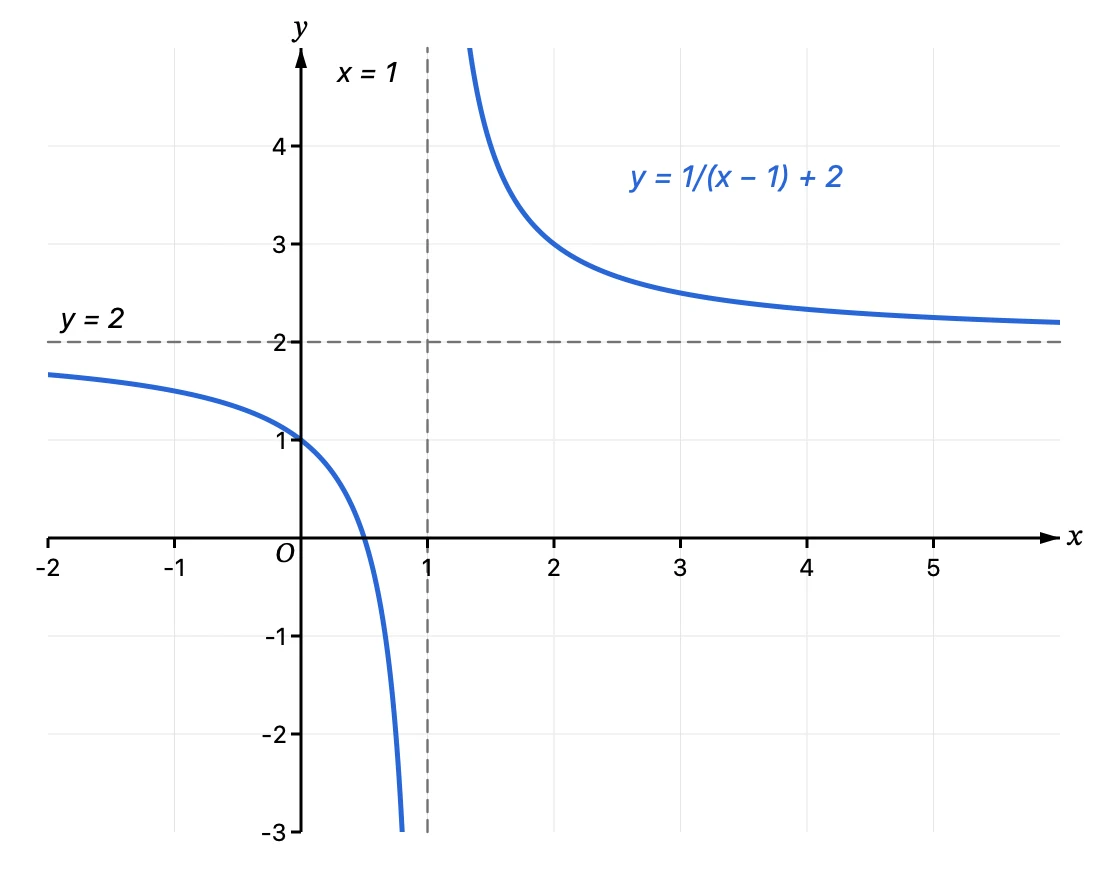
The graph of y = 1/(x − 1) + 2 is the graph of y = 1/x translated 1 unit in the x direction and 2 units in the y direction. The function is undefined at x = 1, so the graph splits into two branches. Graph Sketcher draws it without joining the two sides of x = 1. The asymptotes are dashed straight lines added by hand.
Radical functions and the domain (high school)
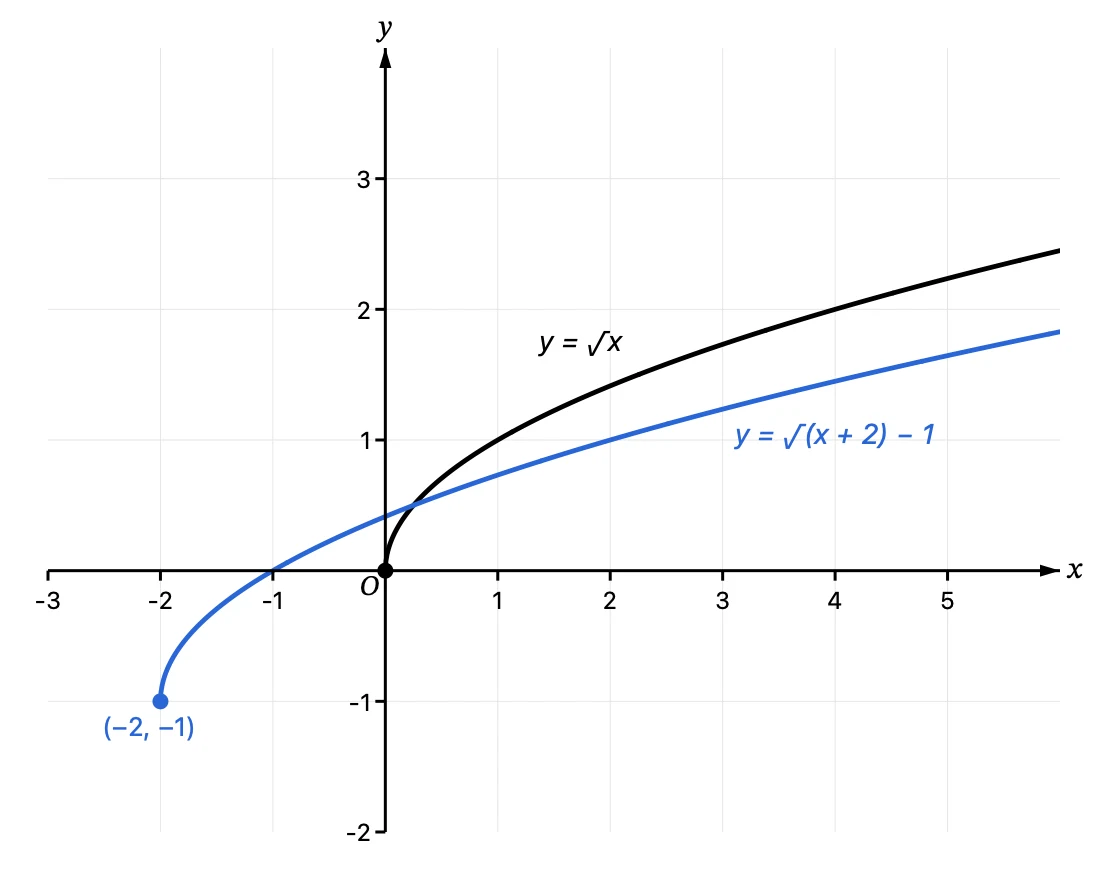
√x is defined only for x ≥ 0, so its graph starts at the origin. For y = √(x + 2) − 1, the endpoint moves to (−2, −1). Graph Sketcher finds the end of the domain precisely, so the graph starts exactly at that point.
Trigonometric functions: period, amplitude and phase (high school)
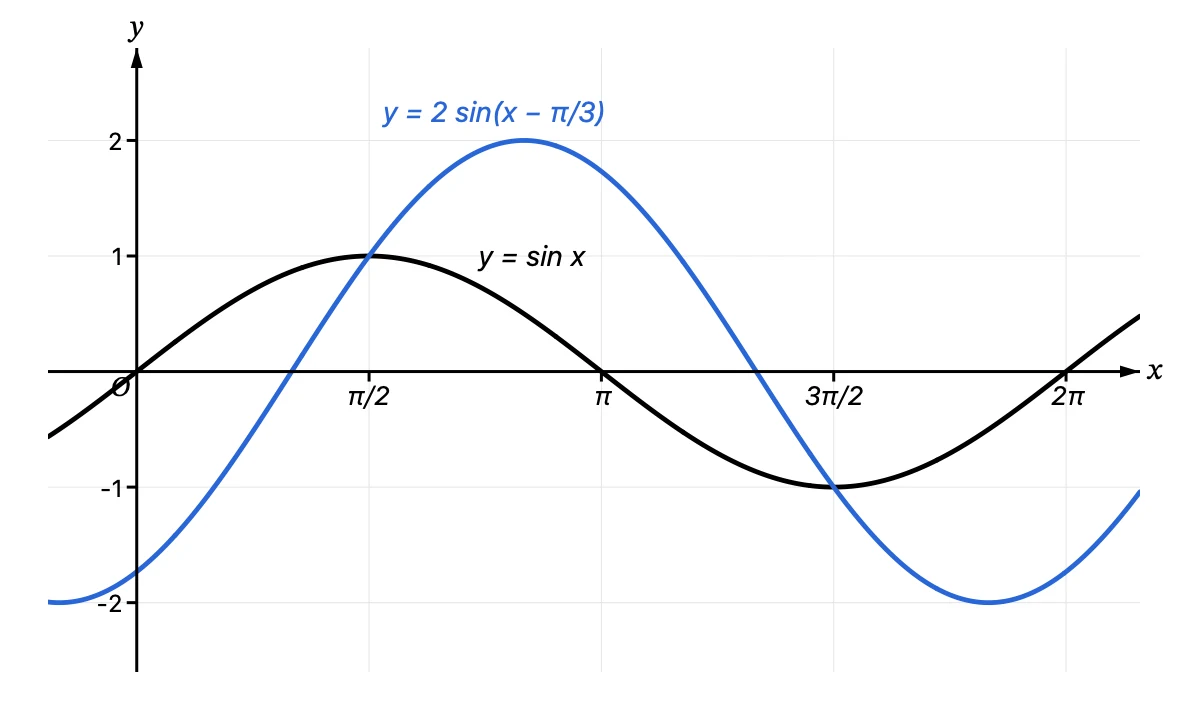
Compared with y = sin x, y = 2 sin(x − π/3) has twice the amplitude (the height of the wave) and is shifted π/3 in the x direction. Both have a period of 2π. You can enter expressions such as 2π for the range. The tick labels such as π/2 were placed with “Text”.
Exponential and logarithmic functions: inverse functions (high school)
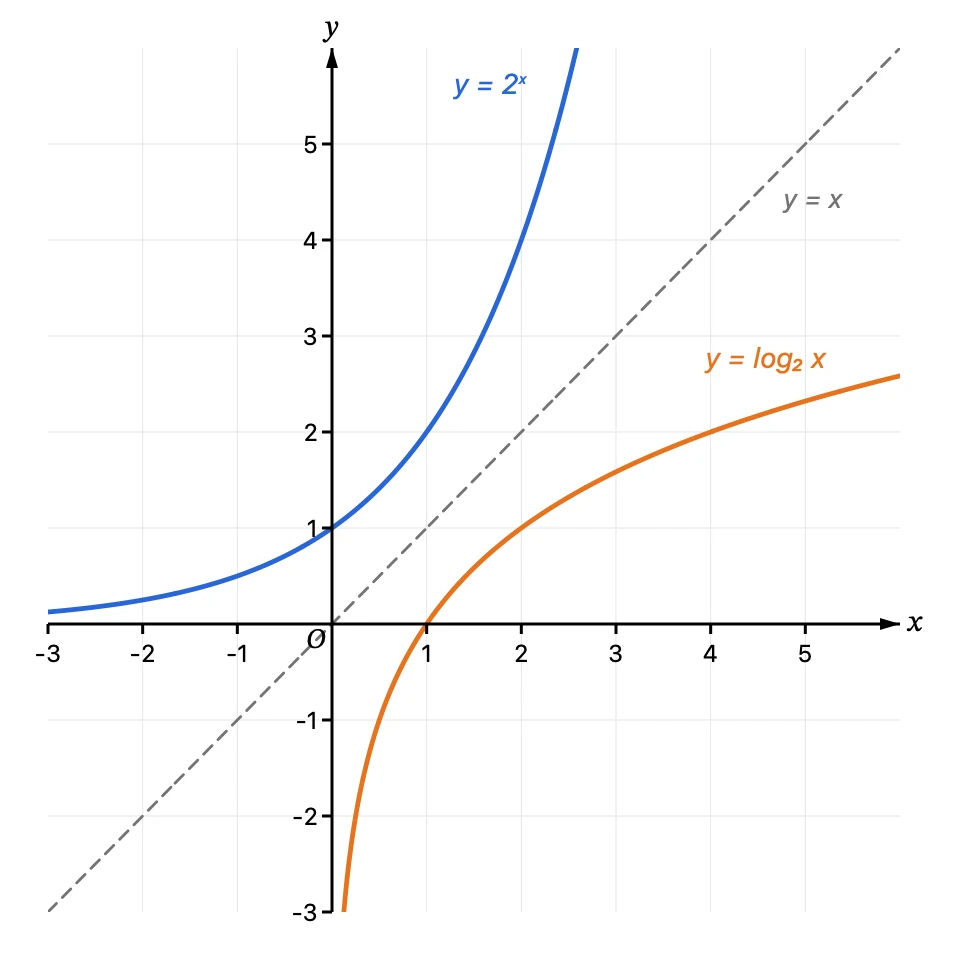
y = log₂ x is the inverse function of y = 2ˣ, and the two graphs are symmetric about the line y = x. The line y = x was also entered as a function and made dashed. To get log₂ x, type log_2(x).
Approximation by Taylor expansion (university)
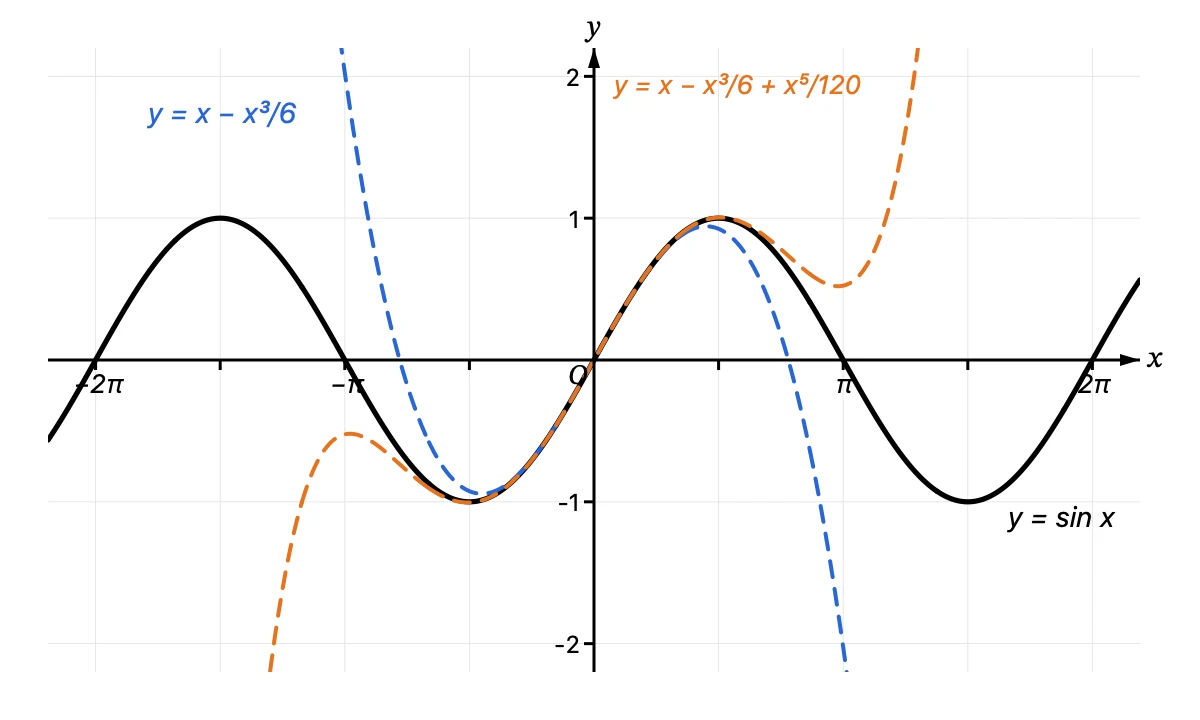
Near the origin, sin x can be approximated by polynomials such as x − x³/6 and x − x³/6 + x⁵/120. The figure shows clearly how the range where the polynomial overlaps sin x widens as you add terms. It also works for university calculus classes and for materials on numerical computation.
How do you combine function graphs with hand-drawn figures?
A function graph drawn from an equation can go in the same document as hand-drawn lines, points, text and fills. Add dashed asymptotes and guide lines, points at intersections and labels such as “Vertex (1, −4)”, and you have a finished figure for a worksheet or to use instead of drawing on the board. You can also combine it with the 19 templates, such as supply and demand or the normal distribution. How to put graphs on worksheets and tests is covered in the article on math worksheet graphs, and how to put them in a paper in the article on thesis diagrams.
When should you use GeoGebra or Desmos, and when Graph Sketcher?
GeoGebra and Desmos are free tools well suited to drawing graphs from equations, exploring them as you change values and showing them in class. Graph Sketcher is an app for drawing exact curves from equations, then adding guide lines, points and text by hand and adjusting line colors and widths to finish figures for worksheets, tests, slides and papers. You can export figures as vector PDFs, so lines and text stay sharp when you enlarge or print them.
What does Graph Sketcher cost, and what does it run on?
Graph Sketcher is available on the Mac App Store and the Microsoft Store. Every feature is free for 3 days from first launch on the Mac and for the first 7 days on Windows, then it’s a one-time purchase. There is no subscription. If you have already bought it, you get the function feature with the update. The Mac version runs on macOS 14 or later, and the Windows version on x64 PCs with Windows 11 or Windows 10 (version 1809 or later). The Windows version’s interface is in Japanese and English. Documents (.graphsketcher) work in both the Mac and Windows versions.
Frequently asked questions
Can Graph Sketcher draw a function graph from an equation?
Yes. From version 2.3, type an equation such as x^2 – 2x – 3 or sin 2x with “Function” in the toolbar, and Graph Sketcher draws an exact graph of that function.
What kinds of function graphs can Graph Sketcher draw?
Functions of the form y = f(x). It can draw polynomials, rational functions, radical functions (√), trigonometric and inverse trigonometric functions, exponential functions, logarithmic functions, hyperbolic functions, absolute value, the floor function and more. It can’t draw parametric equations, polar equations or equations in x and y (implicit functions).
Can I use letters such as a and b in Graph Sketcher functions?
No. The only letters you can use in an equation are x and the constants π and e. To compare graphs for different values of a, draw a separate equation for each, with a number in place of a.
Can Graph Sketcher draw coordinate axes that cross at the origin?
Yes. Select “Axes through origin” in the function editor, or “Cross at 0” in the “Axes” tab, and the coordinate axes become number lines that cross at the origin, with arrows and an O at the origin.
Can Graph Sketcher draw function graphs and hand-drawn lines in the same figure?
Yes. Function graphs drawn from equations can go in the same document as hand-drawn lines, points, text, fills and templates.
Is Graph Sketcher free?
You can try every feature of Graph Sketcher free for 3 days from first launch on the Mac and for the first 7 days on Windows. After that, it’s a one-time purchase, with no subscription.
Summary
- Graph Sketcher 2.3 draws an exact function graph from an equation you type in
- Enter equations on one line, such as x^2 – 1, or with fill-in structures similar to the equation editor in Word
- It draws accurately at the ends of the domain and on both sides of asymptotes, and can make the coordinate axes number lines that cross at the origin
- Combine graphs with hand-drawn guide lines, points and text to finish figures for middle school, high school and university classes and materials, and for papers
→ Learn more about Graph Sketcher