With Graph Sketcher 2.3, you can draw an exact function graph for a test or quiz just by typing its equation. Duplicate the document and edit the graph’s equation, and you can make answer choices for a choose-the-graph question, similar problems with different numbers, and figures for the question and the answer key, all with the same line widths and size.
This article takes four types of problems that math teachers often use on tests and worksheets and shows how to make them in Graph Sketcher. The feature for drawing graphs from equations is covered in detail in the article on function graphs.
| Item | Details |
|---|---|
| Best suited for | Choose-the-graph questions, problems that ask for the equation from a graph, answers to graph-drawing problems, and similar problems and makeup tests with different numbers |
| How graphs are drawn | Function graphs are drawn from equations (from 2.3). Points, coordinate labels and guide lines are added by hand |
| Making similar problems | Duplicate the document, double-click the graph and edit the equation |
| Grid and tick marks | A faint grid is drawn at the tick spacing. You can show or hide the tick numbers |
| Export formats | PDF (vector), PNG (2× resolution), JPEG, TIFF |
| Requirements (as of November 2026) | Mac (macOS 14 or later), Windows (x64 PCs with Windows 11, or Windows 10 version 1809 or later) |
| Price (as of November 2026) | Free for 3 days from first launch on the Mac and for the first 7 days on Windows, then a one-time purchase (no subscription) |
What takes the time with function graphs for tests?
Graphs for a test need more than an exact shape: you also need several figures, each a little different from problem to problem. The time usually goes into these points.
- Accuracy: the vertex and intersections pass through the grid points given by the numbers in the problem
- Number of figures: making many similar figures, such as 4 for the answer choices or 2 for the question and the answer key
- Redrawing: drawing the graph again every time you change the numbers for a similar problem or a makeup test
- Printing: keeping lines and points distinguishable on a black-and-white copy
Graph Sketcher 2.3 draws function graphs from equations, so the vertex and intersections are exactly where the equation puts them. Edit the equation and the curve is redrawn, so however many similar figures you make, the shape stays exact.
How do you make the answer choices for a choose-the-graph question?
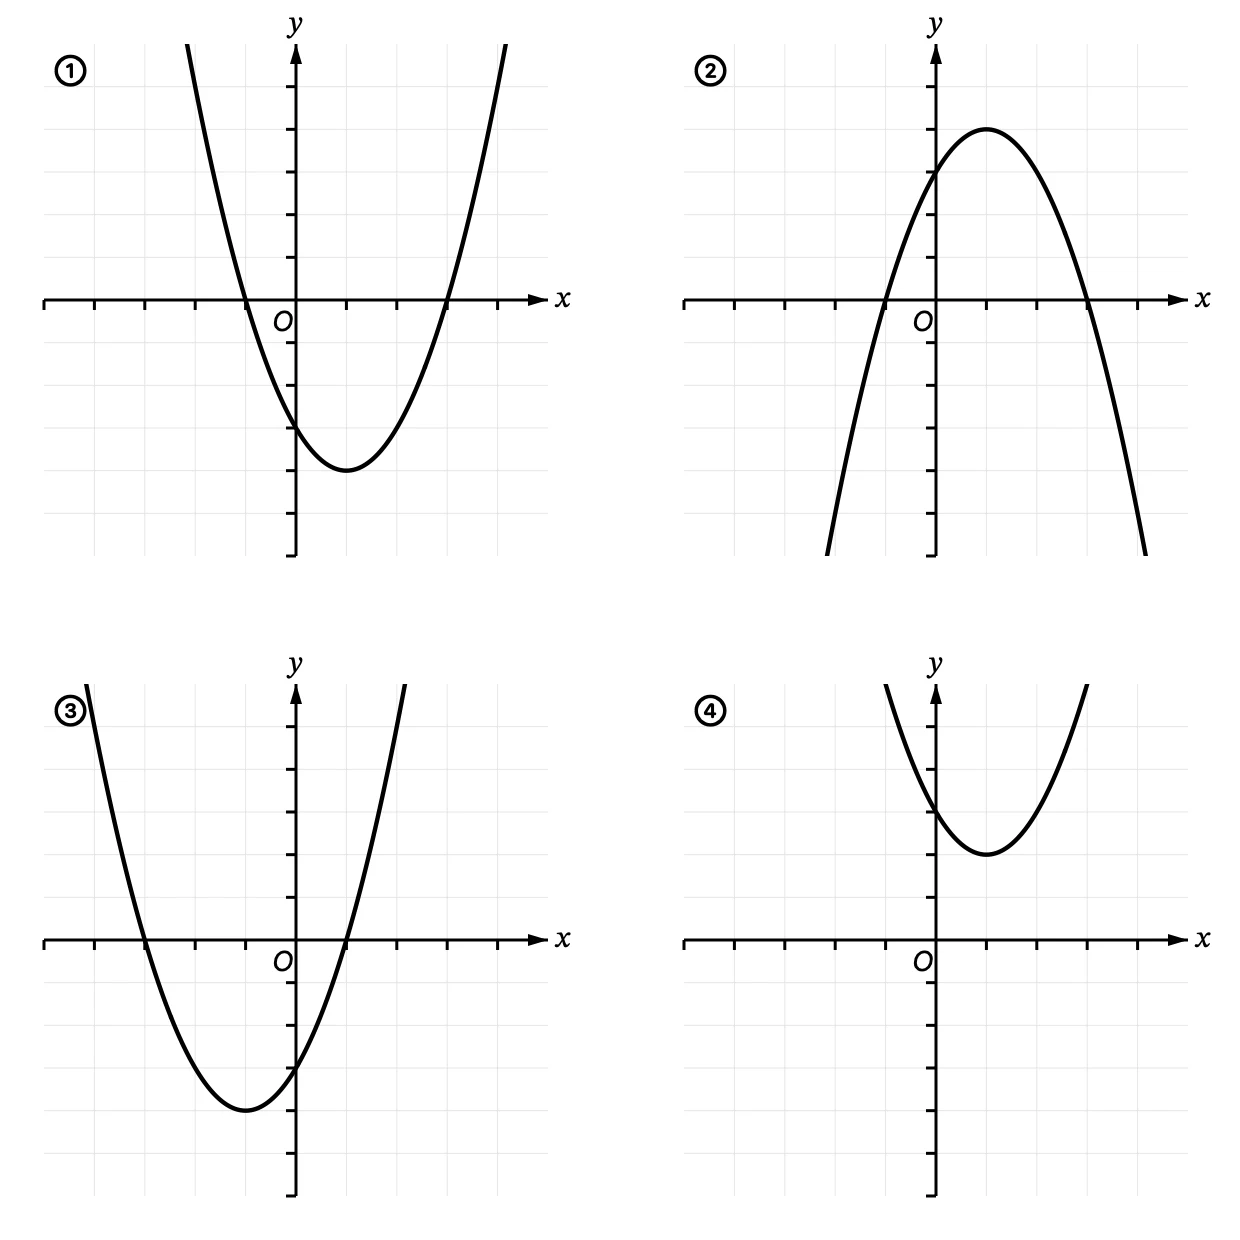
The correct answer ① is y = x² − 2x − 3, while ② is the graph of y = −x² + 2x + 3, ③ of y = x² + 2x − 3 and ④ of y = x² − 2x + 3. If each choice changes the sign of one coefficient, the choice a student picks shows where they went wrong.
- With “Function” in the toolbar, enter the correct equation (x^2 – 2x – 3), write ① with “Text”, and export
- Duplicate the document, double-click the graph, change the equation to -x^2 + 2x + 3, change the label to ②, and export
- Make the remaining choices the same way, editing the equation and the label and exporting each one
- Paste the 4 figures into a table of 2 rows and 2 columns in Word or a similar app. The canvas size is the same, so the figures and their text come out the same size
How do you make the figure for a problem that asks for the equation from the graph?
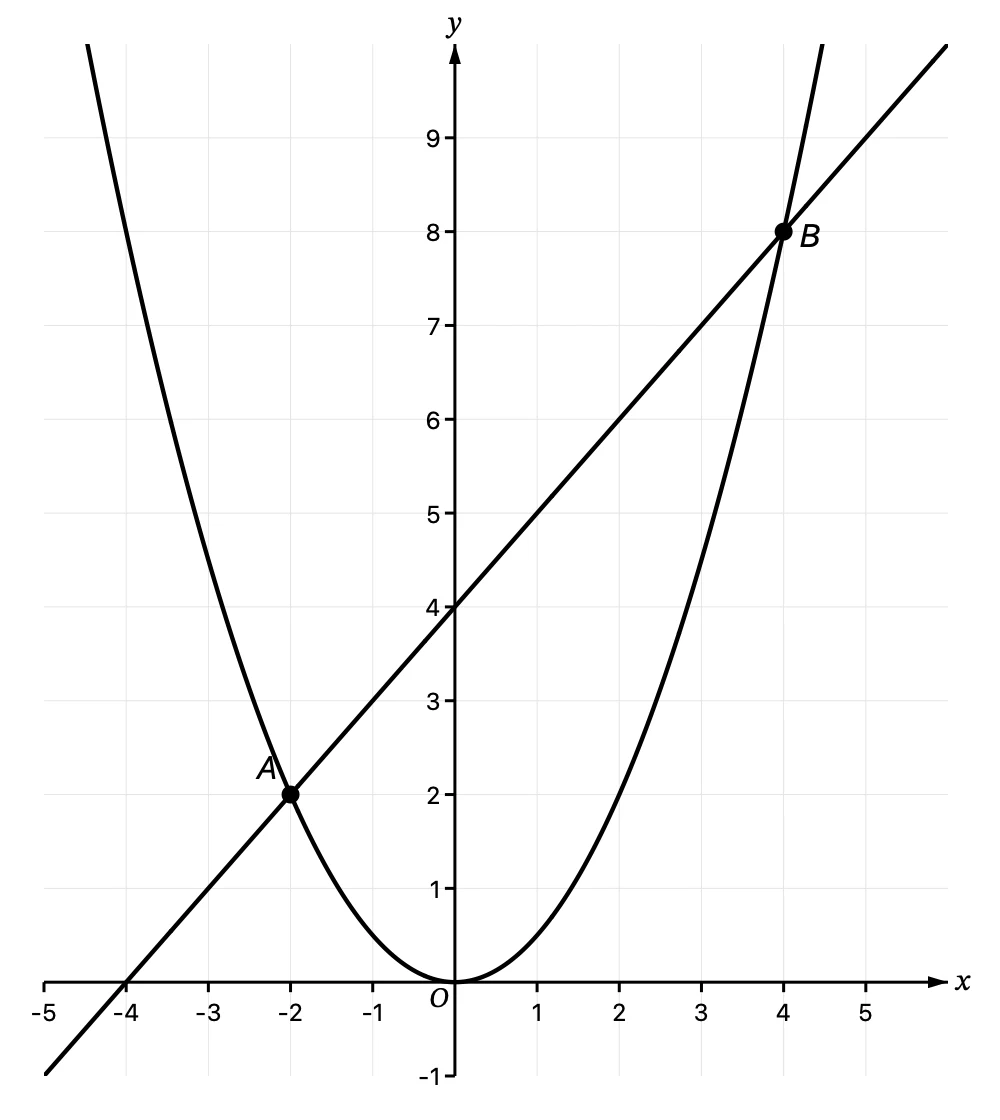
A parabola and a line that meet at two points is a classic figure for the function y = ax² in Algebra 1. Draw both the parabola x^2/2 and the line x + 4 with “Function”. Leave the equations off the figure, and have students read the coordinates from the points and the grid to find the value of a and the equation of the line.
- In the “Axes” tab, turn off “Auto tick spacing” and set the spacing to 1, and you get tick marks and a faint grid at every 1
- Select “Show tick labels” to put numbers on the tick marks. Turn it off for problems where you don’t want students to read the numbers
- Type the coordinates of the intersection points as numbers in the “Data” tab, and they sit exactly on grid points. Place the labels A and B with “Text”
How do you make the figures for the question and the answer key?
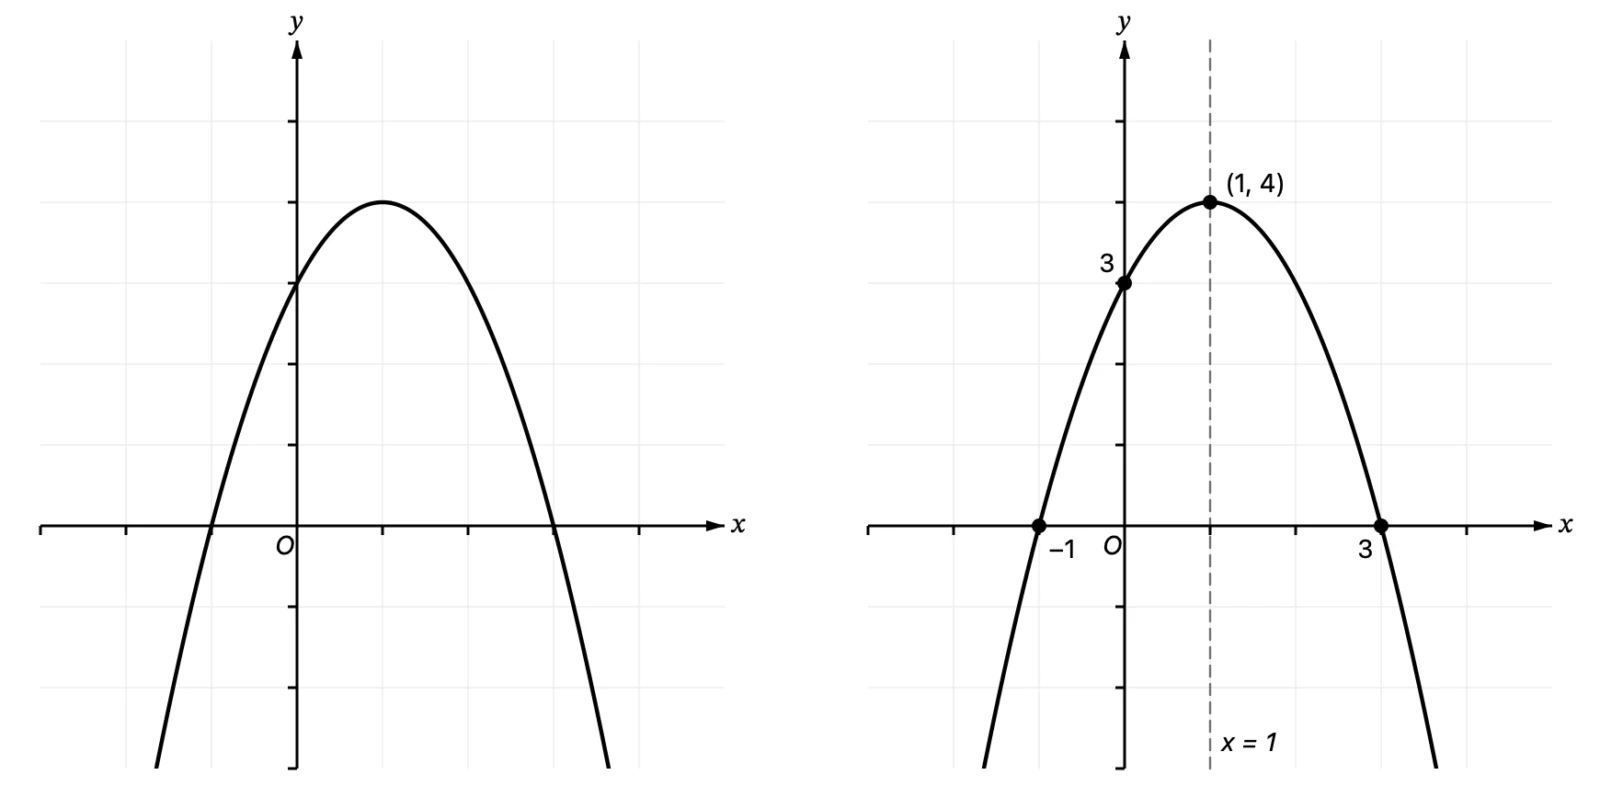
- Make the figure for the question and export it
- Duplicate the document (copy the document file in Finder or File Explorer)
- In the answer key document, add points at the vertex and where the graph meets the coordinate axes, coordinate labels and the dashed axis of symmetry, then export
The function graph is drawn from its equation, so the curve never shifts between the question and the answer key. The points and labels you add don’t go into the question figure, so you can write in what belongs only in the answer key.
How do you make similar problems and makeup tests?
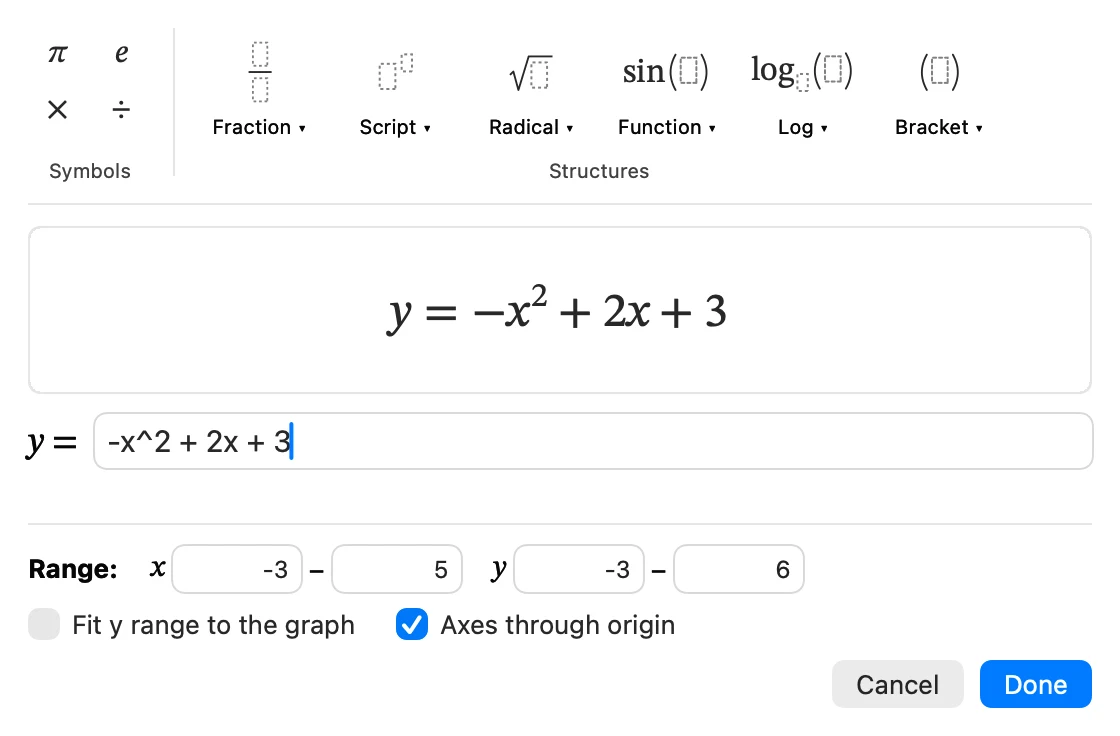
To make a similar problem, duplicate the document, double-click the graph and change the numbers in the equation. You can also select the graph and click “Edit Function…” in “Style”. The curve is redrawn from the new equation, and the line color and width and the axis settings stay as they were.
Points and text you placed by hand don’t move automatically when you edit the equation. If the vertex or intersections move, move the points and text to match. If the graph runs off the frame, select “Fit y range to the graph” in the function editor, and the y range is set automatically.
How do you enter the functions for each grade and course?
You type equations on one line, much as in the equation editor in Word. Here are examples for commonly used functions.
| Grade or course | Example function | What to type |
|---|---|---|
| Grade 7 (direct and inverse variation) | y = 2x, y = 6/x | 2x, 6/x |
| Grade 8 (linear functions) | y = −2x + 3 | -2x + 3 |
| Algebra 1 (the function y = ax²) | y = ½x², y = −x² | x^2/2 or (1/2)x^2, -x^2 |
| Algebra 2 (quadratic functions) | y = 2(x − 1)² + 3 | 2(x – 1)^2 + 3 |
| Precalculus (trigonometric functions) | y = 2 sin(x − π/3) | 2sin(x – π/3) |
| Algebra 2 (exponential and logarithmic functions) | y = 2ˣ, y = log₂ x | 2^x, log_2(x) |
| Precalculus (rational and radical functions) | y = 1/(x − 1) + 2, y = √(x + 2) | 1/(x – 1) + 2, sqrt(x + 2) |
- As in Word, 1/2x is read as 1/(2x). For ½x², type x^2/2 or (1/2)x^2
- You can leave out the multiplication sign (2x, 2sin x). Full-width digits and symbols are also recognized
- The letters you can use are x, π and e. Letters such as a can’t be used, so draw the equation with a number in place of a
How do you adjust figures for black-and-white printing or for projecting in class?
- For tests copied in black and white, make the lines black and tell two or more graphs apart with solid, dashed and double lines. Changing the point shape (circle, square and so on) also helps
- To show figures on a projector or an interactive whiteboard, make the lines wider and the text larger in “Style”. PNGs are exported at twice the resolution, so they stay sharper when enlarged
- Give every figure in the same test the same canvas size, and the text comes out the same size when you paste them in
How to paste exported figures into Word or Google Docs is covered in the article on math worksheet graphs.
What does Graph Sketcher cost, and what does it run on?
Graph Sketcher is available on the Mac App Store and the Microsoft Store. Every feature is free for 3 days from first launch on the Mac and for the first 7 days on Windows, then it’s a one-time purchase. There is no subscription. Drawing function graphs from equations is available from version 2.3 in both the Mac and Windows versions. The Mac version runs on macOS 14 or later, and the Windows version on x64 PCs with Windows 11 or Windows 10 (version 1809 or later). Documents (.graphsketcher) work in both the Mac and Windows versions.
Frequently asked questions
Can Graph Sketcher make function graphs for tests from equations?
Yes. From version 2.3, type an equation such as x^2 – 2x – 3 with “Function” in the toolbar, and Graph Sketcher draws an exact graph of that function. You can add points, text and guide lines and export it as a PDF or PNG.
Can Graph Sketcher make graphs with a grid?
Yes. A faint grid is drawn at the tick spacing. Turn off “Auto tick spacing” in the “Axes” tab and set the spacing to 1, and you get a grid at every 1.
How do you enter ½x² in Graph Sketcher?
Type x^2/2 or (1/2)x^2. If you type 1/2x^2, it’s read as 1/(2x²), as in the equation editor in Word.
How do you make question and answer key figures with the same shape in Graph Sketcher?
Duplicate the question document, then add points, coordinate labels and guide lines to the answer key document. The function graph is drawn from its equation, so the curves in the two figures match exactly.
Can I edit the equation of a function drawn in Graph Sketcher later?
Yes. Double-click the graph, or click “Edit Function…” in “Style”, to edit the equation. The curve is redrawn from the new equation, and the line color and width stay as they were.
Is Graph Sketcher free?
You can try every feature of Graph Sketcher free for 3 days from first launch on the Mac and for the first 7 days on Windows. After that, it’s a one-time purchase, with no subscription.
Summary
- Graph Sketcher 2.3 draws exact function graphs for tests from equations
- Make answer choices for choose-the-graph questions and similar problems just by duplicating the document and editing the equation
- Figures for the question and the answer key come from the same document, so their curves match exactly
- Set up the grid, tick marks and line types to suit both black-and-white printing and projection
→ Learn more about Graph Sketcher